
Pollfish Questionnaire Answer Quotas
Pollfish Questionnaire Answer Quotas: Balance Your Survey Responses More Precisely
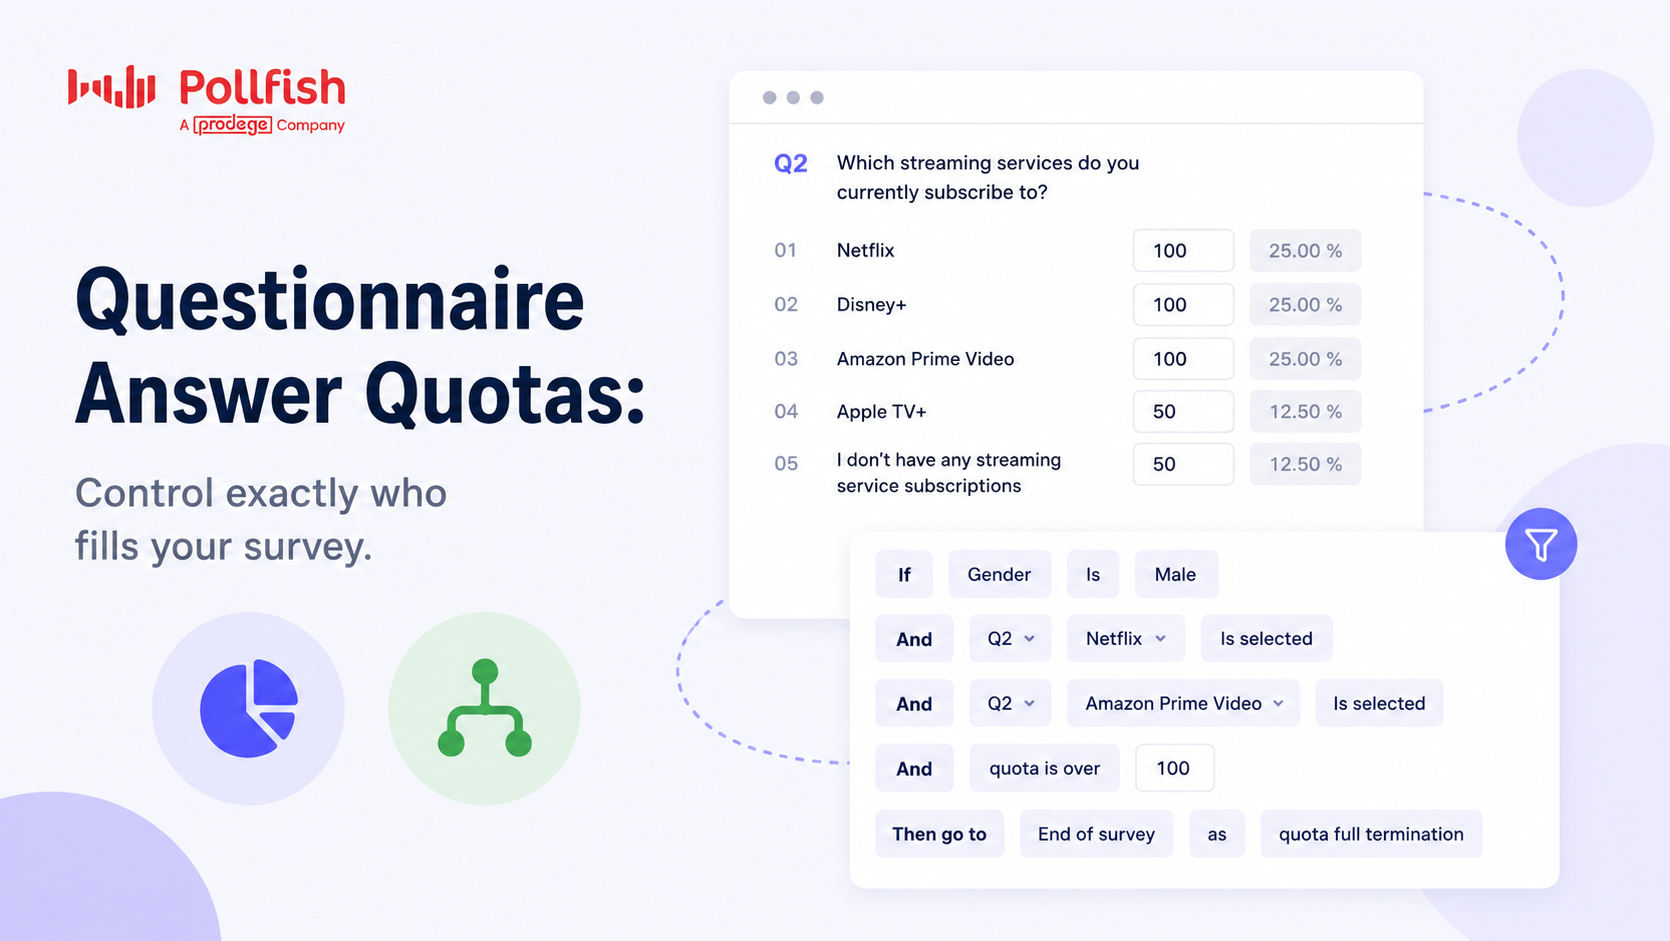 Getting the right number of responses is important. But in many research projects, getting the right mix of responses matters even more.
That’s where Questionnaire Answer Quotas in Pollfish come in.
Answer Quotas allow researchers to control how many respondents qualify based on specific survey answers. This helps you control audience composition, avoid overrepresentation, and ensure reliable research outcomes.
Whether you’re conducting customer research, product testing, concept evaluations, or market segmentation studies, Answer Quotas help you collect a more structured and representative sample.
Pollfish supports two approaches:
- Simple Answer Quotas for fast, straightforward response distributions
- Advanced Conditional Quotas for more sophisticated research logic
This guide explains how both work, when to use them, and how they can improve your survey quality.
What Are Questionnaire Answer Quotas?
Questionnaire Answer Quotas let you limit the number of respondents who qualify for your survey based on how they answer specific questions.
Once a quota is filled:
- Additional respondents matching that criteria are automatically disqualified
- The respondent receives an Answers Overquota participation outcome
This helps prevent certain response groups from dominating your dataset.
Why Use Answer Quotas?
Without quotas, survey results can become unbalanced.
For example:
- Too many respondents from one customer group
- Overrepresentation of heavy users
- Too many fans of one brand
- Not enough responses from competing audiences
- Uneven concept exposure
Answer Quotas help researchers:
- Balance samples
- Improve segmentation quality
- Control study composition
- Reduce skewed datasets
- Improve comparison analysis
Simple Answer Quotas
The Simple Answer Quota approach is designed for researchers who want an easy, familiar way to prevent overrepresentation.
It works similarly to standard survey quotas and audience targeting.
Researchers can simply:
- Open a supported question type
- Toggle Add Quota from the left hand sub-menu
- Enter the quotas for each answer
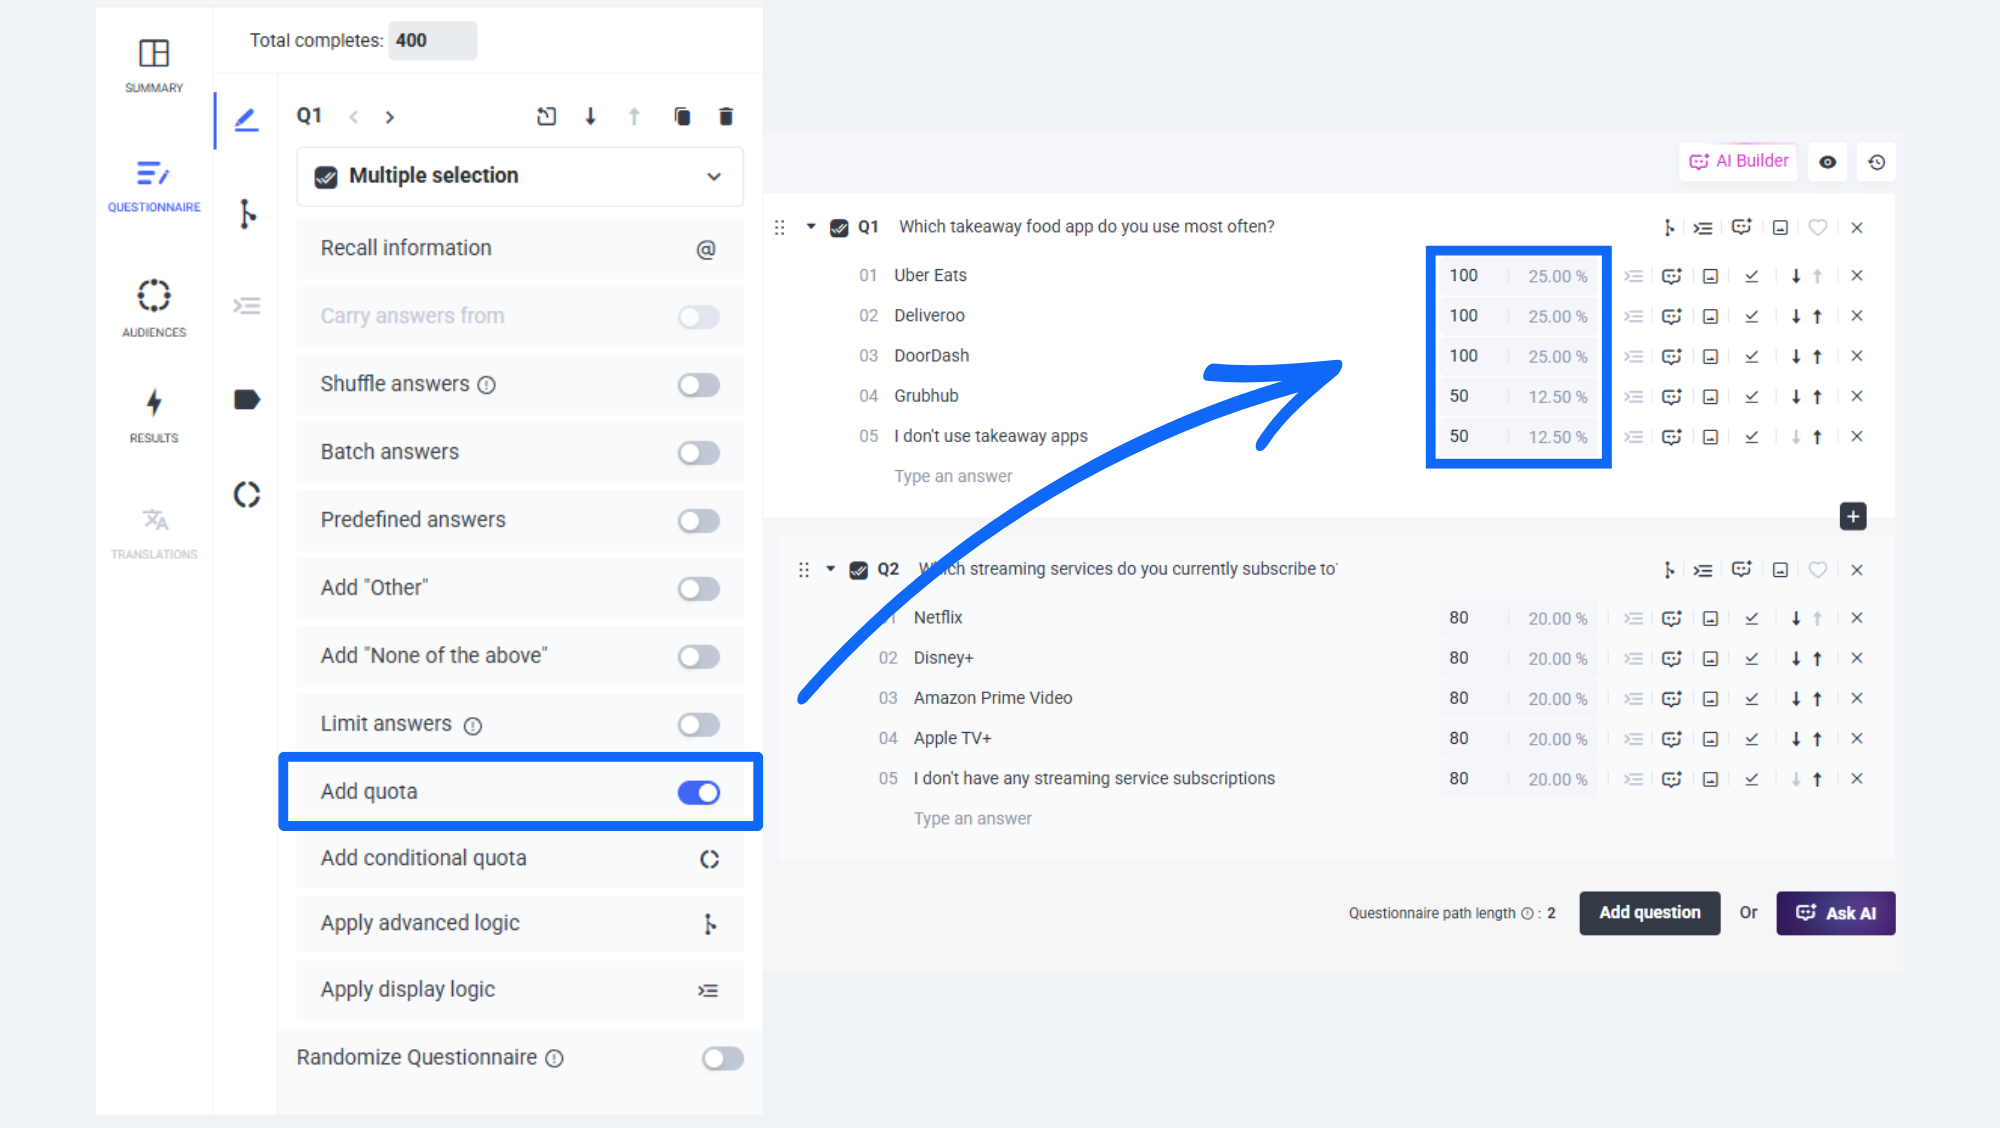
Example: Takeaway App Usage Research
Imagine you're researching takeaway delivery habits.
You ask:
Which takeaway food app do you use most often?
- Uber Eats
- Deliveroo
- DoorDash
- Grubhub
- I don’t use takeaway apps
You may want:
- 100 Uber Eats users
- 100 Deliveroo users
- 100 DoorDash users
- 50 Grubhub users
- 50 non-users
Once the quota for Uber Eats reaches 100:
- Additional Uber Eats respondents are screened out as Answers Overquota
- Other groups can continue the survey
This helps prevent overrepresentation while ensuring you collect the right mix of respondents for your research goals.
Supported Question Types
Simple Answer Quotas currently support:
- Single selection
- Multiple selection
- Matrix single selection
- Matrix multiple selection
- Matrix bipolar
For more advanced logic requirements, researchers can use Conditional Quotas instead.
Advanced Conditional Quotas
Advanced Conditional Quotas are available for Enterprise accounts and are designed for researchers who need more sophisticated audience control and survey logic.
Conditional quota rules are configured directly within specific survey questions, allowing researchers to apply participation limits tied to question answers, demographics, and other survey conditions.
This is ideal for:
- Complex segmentation
- Advanced targeting
- Concept testing
- Multi-variable studies
The setup is similar to our advanced survey logic feature.
- Open a supported question type
- Click Add Conditional Quota from the left hand sub-menu
- Select your quota condition rules from Answers and/or Audience criteria
- Add your quota limit
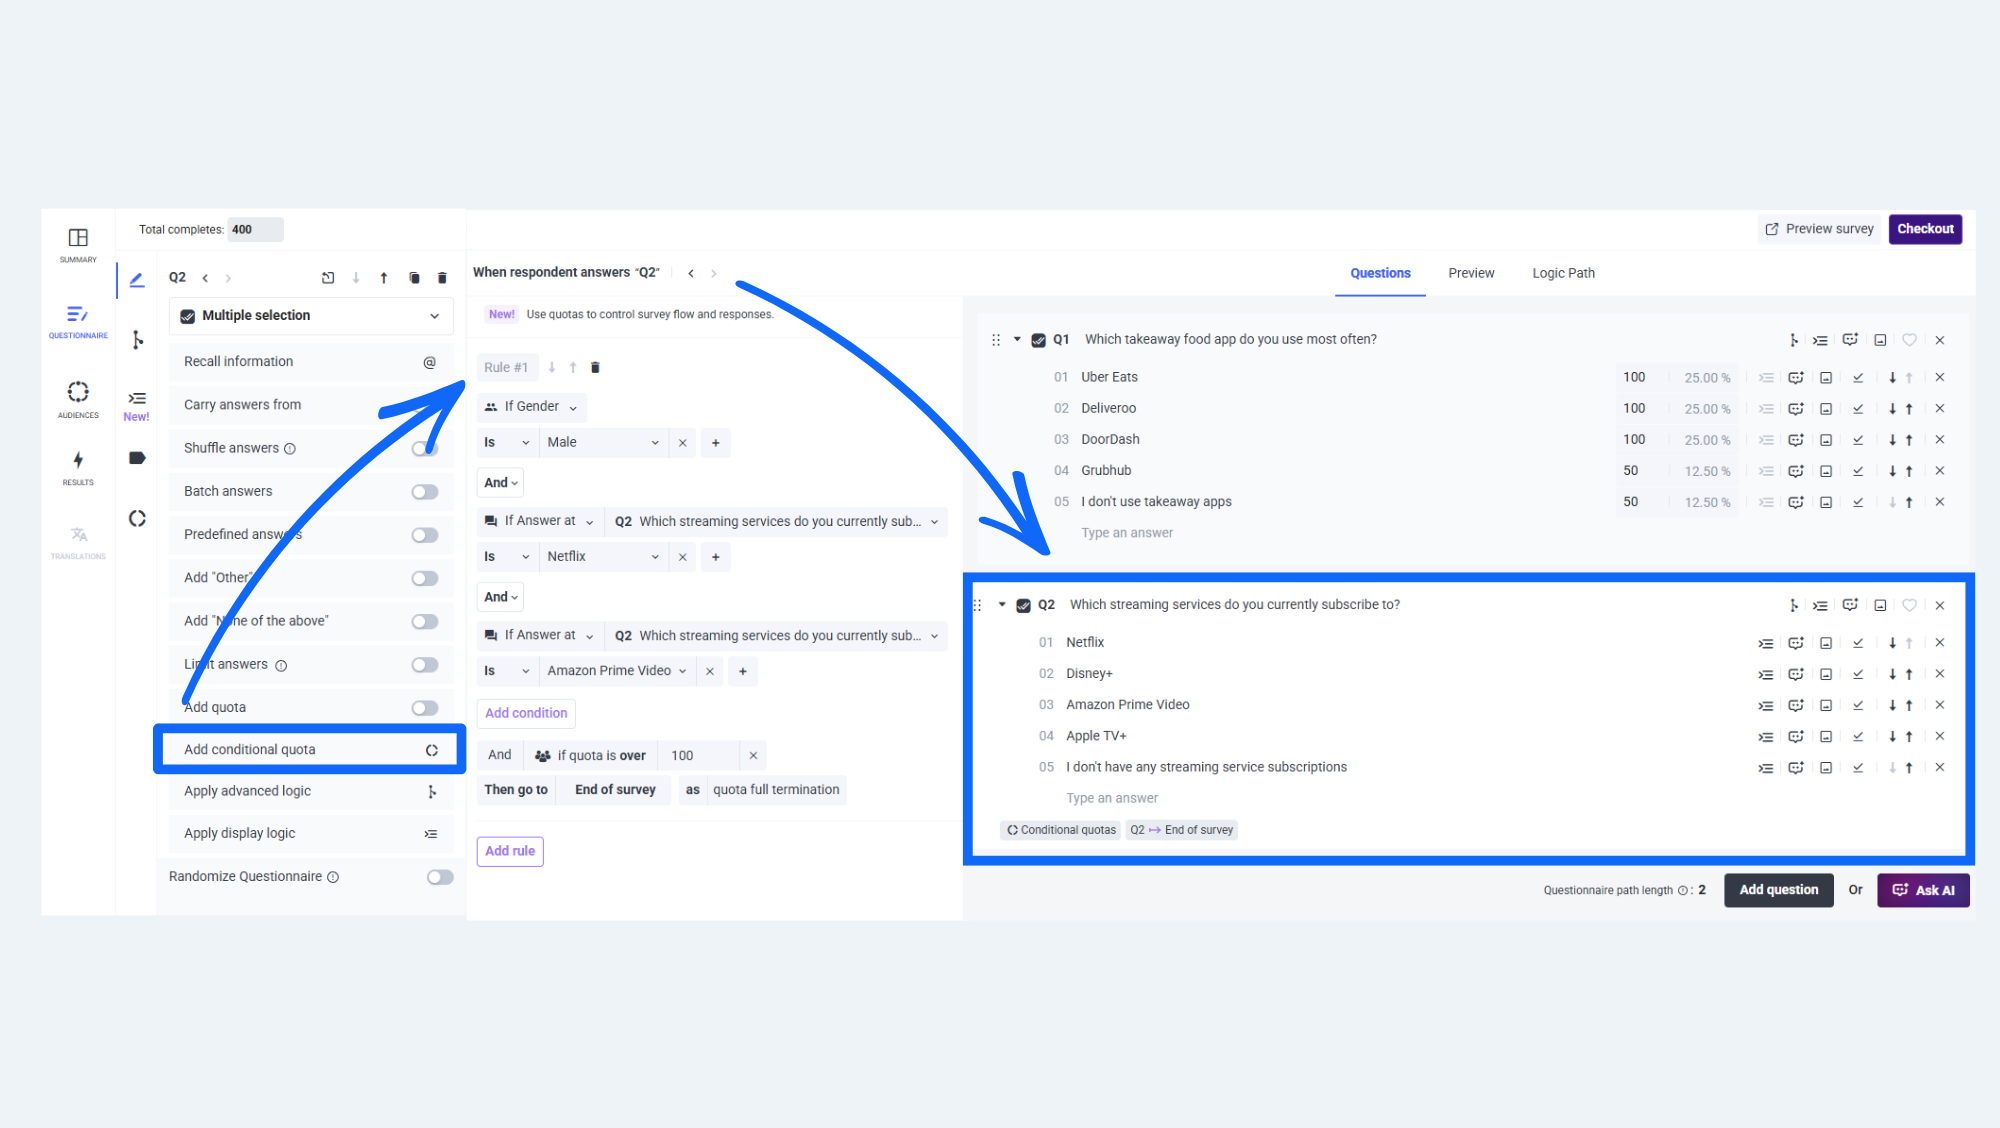
Example 1: Streaming Service Research
Imagine you're researching streaming subscription habits and want to collect a very specific audience segment.
-
You ask:
Which streaming services do you currently subscribe to?
- Netflix
- Disney+
- Amazon Prime Video
- Apple TV+
- I don't have any streaming service subscriptions
You then create a conditional quota rule:
- Gender = Male
- AND selected Netflix
- AND selected Amazon Prime Video
Quota target:
- 100 respondents
Once 100 respondents match all conditions:
- Additional matching respondents are automatically disqualified as Answers Overquota
- The rest of the survey can continue collecting normally
This allows researchers to control exactly which audience combinations are included in their study without manually reviewing responses.
Example 2: Brand + Demographic Conditions
You want:
- 75 male respondents aged 18–34 who use both Uber Eats and Deliveroo
Quota rule:
- Uses Uber Eats
- AND Uses Deliveroo
- AND Gender = Male
- AND Age = 18–34
This allows researchers to control exactly which audience combinations are included in their study.
Example 3: Concept Testing with Experimental Conditions
Imagine you're running an A/B concept test.
You want:
- 50 respondents who:
- Prefer oat milk
- AND saw Concept B
- AND live in California
Conditional quotas allow researchers to manage these highly specific combinations automatically.
When Should You Use Advanced Quotas?
Advanced Conditional Quotas are especially useful for:
Concept Testing
Balance audiences across test conditions.
Brand Comparisons
Ensure equal representation across competitors.
Customer Segmentation
Control quotas across multiple demographic and behavioral variables.
Product Usage Studies
Balance responses between light users, heavy users, and non-users.
Automatic Pause & Review Protection
One challenge with quotas, especially on multiple-selection questions, is that a single respondent may count toward multiple answer quotas simultaneously.
This can cause certain quota groups to fill faster than expected before the survey reaches its required completes.
For example:
- One answer quota becomes full
- But the overall survey still hasn’t reached required completes
To help prevent incomplete studies, Pollfish includes a Pause Due to Quotas protection system.
If quota limits prevent the survey from reaching its required completes:
- The survey may automatically pause with a “Paused due to quotas” status
- Researchers receive a notification email
- The email highlights which quota or rule requires attention
Researchers can then:
- Adjust quota targets
- Increase remaining allocation
- Resume data collection
This helps protect survey quality and completion goals.
Editing Quotas Mid-Study
Pollfish also tracks:
- Existing responses
- Filled quota counts
- Remaining allocation per answer
Researchers can adjust quotas during fieldwork without rebuilding the survey.
This is particularly helpful when:
- Audience incidence differs from expectations
- Certain groups fill faster than anticipated
- Additional balancing is needed
Results & Reporting
Answer Quota disqualifications are visible throughout Pollfish reporting.
Researchers can monitor:
- Overquota disqualifications
- Rule-level performance
- Quota fulfillment progress
- Screening metrics
These outcomes are also included in:
- Results dashboards
- Screenout exports
- Survey summaries
This makes it easier to analyze:
- Which audience groups filled fastest
- Where balancing challenges occurred
- How quota rules impacted collection
Best Practices for Answer Quotas
Avoid Overly Restrictive Rules
Very narrow quota combinations can slow collection significantly.
Try balancing precision with realistic incidence rates.
Monitor Early Performance
Check quota fill rates early during fieldwork to avoid unnecessary pauses.
Use Advanced Quotas Strategically
Not every study requires complex conditional logic.
Simple quotas are often sufficient for:
- Brand balancing
- Audience splits
- Basic segmentation
Use advanced rules when multiple conditions truly matter.
Keep Quotas Early in the Survey
Pollfish currently supports Answer Quotas up to Question 8.
Earlier qualification logic generally improves respondent experience and collection efficiency.
Final Thoughts
Questionnaire Answer Quotas give researchers far greater control over survey composition and sample balancing.
Simple quotas make it easy to structure datasets quickly.
Advanced Conditional Quotas unlock sophisticated audience management for more complex research designs.
Whether you’re balancing brand users, managing concept exposure, or building highly segmented studies, Answer Quotas help ensure your final dataset is more reliable, comparable, and research-ready.
Ready to build more balanced surveys?
Explore Pollfish Survey Features

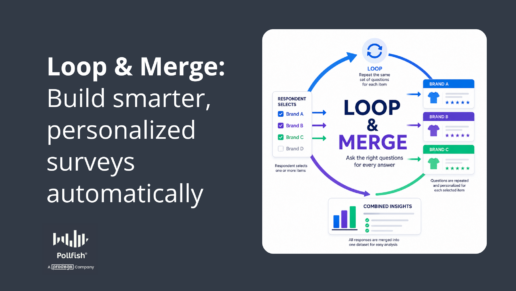
Pollfish Loop & Merge: Create Smarter, More Personalized Surveys
Loop and Merge: Dynamic surveys without complex, manual survey programming.
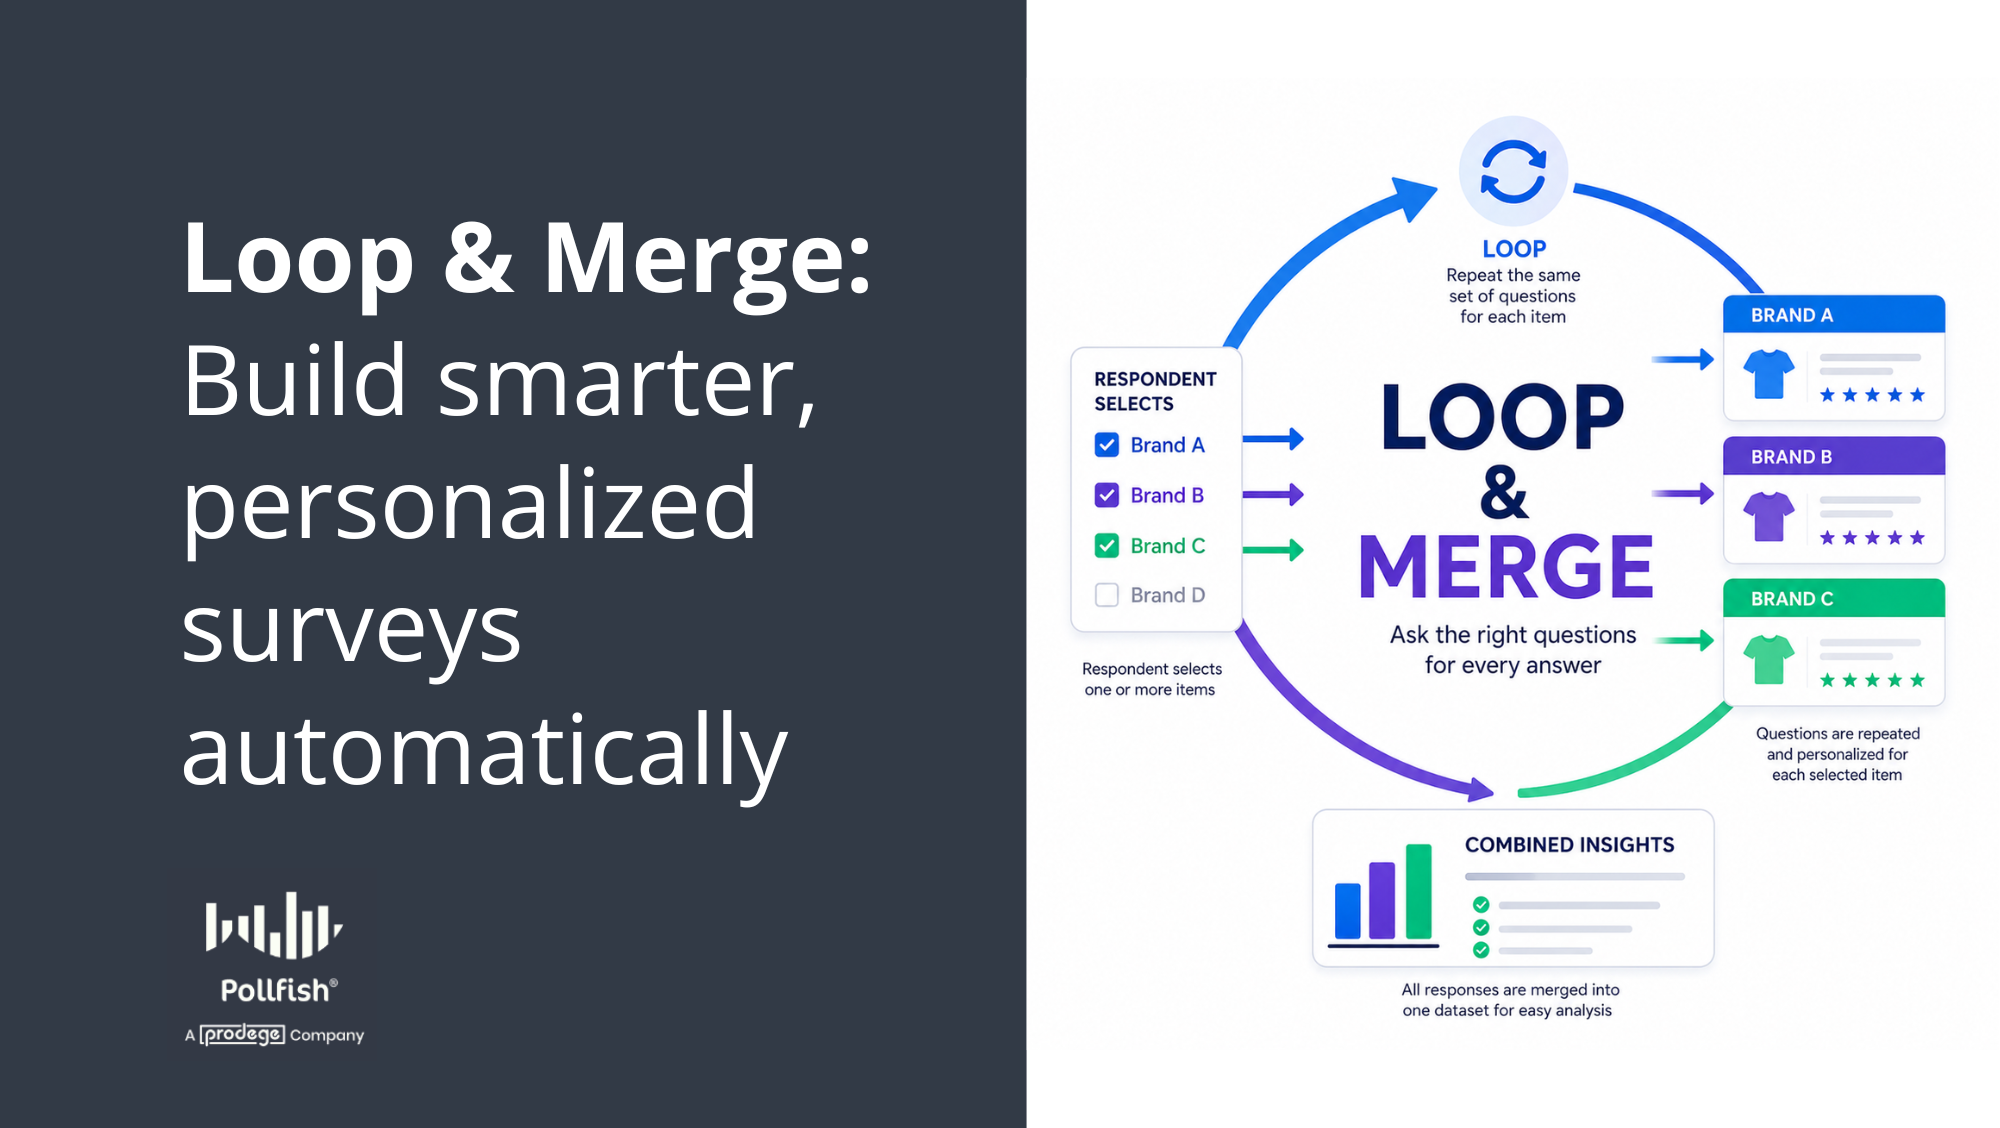
Survey research works best when questions feel relevant to each respondent. But building personalized surveys manually can quickly become time-consuming and difficult to manage, especially when you're comparing multiple products, brands, concepts, or experiences.
That’s where Loop & Merge in Pollfish comes in.
Loop & Merge helps you dynamically repeat groups of questions using answers from previous questions, demographic data, or custom variables. Instead of manually duplicating question blocks over and over, Pollfish automatically generates tailored follow-up questions for each respondent.
The result:
- More personalized surveys
- Faster survey setup
- Cleaner logic
- Better respondent engagement
- More scalable research designs
Whether you're running brand tracking, product evaluations, course feedback surveys, or concept testing, Loop & Merge can dramatically simplify advanced survey workflows.
What Is Loop & Merge?
Loop & Merge is a survey logic feature that repeats a group of questions multiple times while dynamically replacing variables within those questions.
In simple terms:
- A respondent selects or qualifies for certain items
- Pollfish creates a repeated question block ("loop") for each item
- Variables inside the questions automatically update for each loop
Instead of building separate question sets manually, you build the question group once and Pollfish handles the repetition automatically.
A Simple Example
Imagine you're conducting apparel brand research.
You first ask respondents:
Which clothing brands do you regularly purchase from?
- Nike
- Adidas
- Levi’s
- H&M
If a respondent selects:
- Nike
- Levi’s
Pollfish can automatically repeat the same follow-up questions twice:
Loop 1
- How satisfied are you with Nike's quality?
- How likely are you to recommend Nike?
Loop 2
- How satisfied are you with Levi’s quality?
- How likely are you to recommend Levi’s?
Without Loop & Merge, you'd need to manually build separate question blocks for every possible brand combination. With Loop & Merge, the survey adapts automatically.
Why Use Loop & Merge?
Loop & Merge is especially valuable when respondents may evaluate:
- Multiple brands
- Multiple products
- Multiple services
- Multiple experiences
- Multiple concepts
- Multiple locations
- Multiple courses or classes
Instead of asking generic questions, you can personalize follow-ups for each selected item.
This often improves:
- Survey relevance
- Completion rates
- Data quality
- Respondent engagement
It also significantly reduces survey programming time for researchers.
Common Research Use Cases
✅Brand Tracking & Competitive Analysis
Ask respondents which brands they use, then dynamically evaluate each selected brand individually.
Example:
- Brand satisfaction
- Purchase frequency
- Brand perception
- Net Promoter Score (NPS)
- Likelihood to switch
✅Product Testing
Allow respondents to review multiple products they’ve tried.
Example:
- Product quality
- Ease of use
- Value for money
- Purchase intent
✅Concept Testing
Present several concepts or ad creatives and repeat evaluation questions for each one.
Example:
- Appeal
- Relevance
- Uniqueness
- Purchase likelihood
✅Educational & Course Feedback
Perfect for academic or training surveys.
Example:
- Course satisfaction
- Instructor feedback
- Learning effectiveness
✅Customer Experience Research
Ask respondents about multiple stores, services, or locations they interacted with.
How Loop & Merge Works
Loop & Merge is built around two key components:
1. Loops
Loops define how many times the question group repeats.
Each loop represents one item being evaluated.
For example:
| Loop | Product |
|---|---|
| 1 | Nike |
| 2 | Levi's |
| 3 | Adidas |
2. Variables
Variables are placeholders dynamically inserted into questions.
For example:
How satisfied are you with [Brand]?
Pollfish replaces [Brand] automatically during each loop.
Result:
- How satisfied are you with Nike?
- How satisfied are you with Levi’s?
- How satisfied are you with Adidas?
Where to Find Loop & Merge in Pollfish
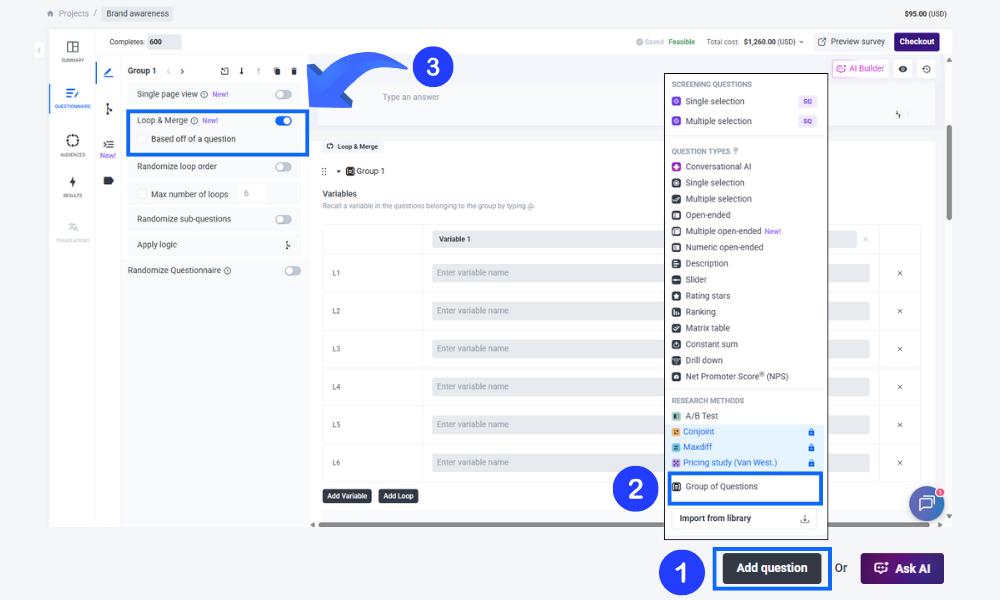
You can access Loop & Merge while building your survey:
- Create or edit a survey
- Click Add Question
- Select Group of Questions
- Enable Loop & Merge in the group settings panel
Once enabled, you can configure:
- Variables
- Loop sources
- Randomization
- Loop limits
- Logic behavior
Variable Sources Supported
Loop & Merge supports several types of dynamic variables.
Manual Variables
You manually define values inside the loop table.
Example:
| Loop | Product |
|---|---|
| 1 | Coffee |
| 2 | Tea |
| 3 | Juice |
Useful for:
- Controlled concept tests
- Structured comparisons
- Fixed product sets
Previous Question Answers
Variables can come directly from respondent selections.
Example:
- Selected brands
- Purchased products
- Preferred services
This is one of the most powerful use cases because surveys adapt uniquely for every respondent.
Demographic Variables
You can also personalize loops using demographic criteria.
Examples:
- Region
- Household type
- Pet ownership
- Age groups
Combined Variables
Loop & Merge also supports combinations of:
- Previous answers
- Manual entries
- Demographic data
This enables highly customized survey flows while maintaining clean logic.
Advanced Loop & Merge Features
Randomize Loop Order
You can randomize the sequence of loops to reduce order bias.
Example:
- Respondents see brands in a different order
This helps improve data quality in comparative studies.
Limit Number of Loops
You can cap the maximum loops shown.
Example:
- Respondent selects 10 brands
- Survey only evaluates 3 randomly selected brands
This helps control survey length and fatigue.
Multiple Question Type Support
Loop & Merge supports many Pollfish question types, including:
- Single select
- Multi select
- Ranking
- Open-ended
- Rating scales
- Matrix questions
This allows flexible and sophisticated research designs.
Intelligent Validations
Pollfish automatically checks configurations and alerts you if:
- Variables are missing
- Logic may break
- Combinations are invalid
- Data consistency could be affected
These safeguards help reduce programming errors.
Understanding Maxpath & Survey Flow
Because Loop & Merge dynamically repeats questions, the number of questions shown to each respondent can vary.
Pollfish automatically adjusts the survey maxpath accordingly.
For example:
- A respondent selects 3 brands
- Your Loop & Merge block contains 4 questions
The respondent will answer:
- 12 loop-generated questions total
Pollfish handles this automatically to ensure:
- Accurate survey flow
- Proper routing
- Correct reporting behavior
No manual calculations are required.
Data Exports & Reporting
Loop & Merge data exports work similarly to Pollfish’s sequential A/B structures.
This means:
- Results remain organized
- Responses stay tied to each loop
- Analysis remains scalable
You can still:
- Export data normally
- Use integrations
- Segment responses
- Analyze loop-level results
This makes Loop & Merge practical for both simple and advanced reporting workflows.
Best Practices for Loop & Merge Surveys
Keep Loop Groups Focused
Avoid overly large repeated blocks. Shorter loops typically maintain better respondent engagement.
Use Loop Limits Strategically
If respondents may select many items, consider limiting loops to avoid survey fatigue.
Randomize When Comparing Items
Randomization helps reduce positional bias when evaluating brands, products, or concepts.
Test Your Survey Thoroughly
Preview multiple respondent paths to ensure:
- Variables populate correctly
- Logic behaves as expected
- Loop counts remain manageable
When Should You Use Loop & Merge?
Loop & Merge is ideal when:
- The same question set applies to multiple items
- Personalization improves response quality
- Manual duplication would be inefficient
- You want scalable survey logic
It may be unnecessary for very short or simple surveys with only one evaluation target.
Final Thoughts
Loop & Merge makes advanced survey personalization far more accessible.
Instead of manually building repetitive logic structures, researchers can create dynamic, respondent-specific experiences with significantly less effort.
For experienced researchers, it unlocks scalable advanced survey designs.
For newer researchers, it simplifies workflows that would otherwise require complex manual programming.
Whether you're comparing brands, testing concepts, evaluating products, or collecting detailed feedback, Loop & Merge helps you build smarter surveys that feel more relevant to every respondent.
Ready to try it?
Evolving Pricing to Better Support Your Research Needs
More advanced tools and smarter savings - coming July 15
We’re introducing updates to Pollfish features and pricing, taking effect on July 15, 2026.
Our goal is simple: better align pricing with how teams actually run research today, while giving you more flexibility and access to powerful tools.
Why We’re Making This Change
As more teams use Pollfish across different stages of research, we’ve seen clear patterns emerge:
- Quick, short surveys with broad audiences for fast answers
- Longer, more targeted studies requiring greater complexity and support
- Growing demand for advanced tools, without needing upfront commitments
These updates are designed to better reflect these real-world use cases.
What’s Changing
A Pricing Model That Reflects How Teams Work
From July 15:
- Short surveys and broad audience targeting will generally become more affordable
- Longer surveys and highly specific audiences may see slight price increases, reflecting the effort required to maintain high-quality data
As always, pricing will remain fully transparent in your dashboard as you build your survey.
More Advanced Tools Will be Available on DIY
We’re also expanding what’s included in the DIY platform, with no annual commitment required.
From July 15, you’ll have access to:
- Advanced research methodologies, including Conjoint, MaxDiff, and Van Westendorp pricing models
- Fewer limits on screening questions and survey length
- Time-saving tools like custom audience templates, advanced AI Reports, and conversational AI question types
Flexible Ways to Run Research
Pollfish supports multiple ways to run research depending on your needs:
DIY Platform
Starting from $0.95 per complete
Best for fast, self-serve research with full control.
Full Service Projects
From $5,000 per project
End-to-end research support, including design, audience sourcing, and reporting.
Enterprise
From $10,000 annual prepayment
Designed for teams running research regularly.
When Teams Choose Enterprise
For teams running ongoing research, Enterprise offers a simpler and more cost-efficient way to scale.
How it works
- Prepay funds (starting from $10,000 per year)
- Credits are added to your Pollfish account
- Draw down as you run surveys
- Receive discounted pricing (10%-25%) based on total spend
- And get additional benefits to support your research goals
While DIY pricing starts from $0.95 per complete, Enterprise plans reduce your effective cost per response as your research volume increases.
💡 Rule of thumb: If you expect to spend $10k+ per year, Enterprise will reduce your overall cost.
Important: Enterprise is not a subscription or fee - it’s prepaid research credit you use over time.
Speak to our team about Enterprise (for $10,000+ annual research spend)
Additional Benefits with Enterprise
Enterprise plans also include:
- Dedicated account manager
- Access to professional services (survey programming, data dashboards, translations, B2B audience sourcing)
- Invoice-based billing (instead of per-survey card payments)
- Insights Builder (advanced analysis dashboard)
- Team budget controls
Need Help With a Complex Project?
For high-impact or resource-intensive research, our Full Service team can handle everything:
- Survey design
- Audience sourcing
- Analysis and reporting
Projects start from $5,000 and are ideal for one-off or high-stakes studies when your resources or research experience needs support.
Plan your Full Service project with our team (from $5,000+)
What You Need to Do
Nothing yet - price changes will automatically take effect on July 15.
If you’d like to prepare ahead of time, you can:
- Review the types of surveys you typically run
- Consider your expected research frequency and annual spend
- Evaluate whether DIY or Enterprise is the best fit
Log in to your dashboard to review your current projects
As always, we’re here to support your research goals.
The Pollfish Team
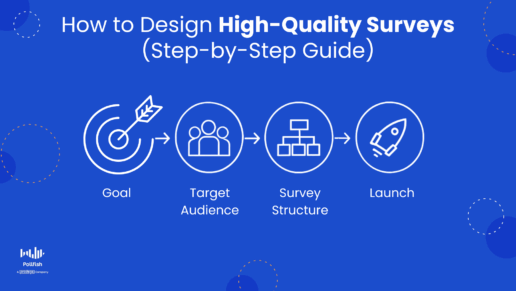
How to Design High-Quality Surveys (Step-by-Step Guide)

Better Survey Design = Better Decisions
Designing a high-quality survey is a critical, but often overlooked skill in market research. A great survey delivers clear, unbiased, actionable insights. A poorly designed one can mislead your team, confuse respondents, waste budget, and derail strategic decisions.
This Pollfish School guide walks you through how to design a survey, choose the right audience, write effective survey questions, and use Pollfish tools to improve data quality and respondent experience.
Whether you’re running a brand study, product test, audience segmentation, or ad evaluation, these survey best practices will help you collect stronger insights from the very start.

1. Start With a Clear Research Goal (Pollfish AI Survey Builder Can Help You Define One)
A strong survey always begins with a clear, actionable research goal. But from the thousands of surveys we review every month, many customers aren’t fully sure what they need to ask or which decision the survey will inform. That’s completely normal, and now, Pollfish can help.
Let Pollfish AI Help Define Your Goal
If you’re unsure how to articulate your goal, the Pollfish AI Survey Builder can assist. Try prompting it with something like:
“Can you help me define my research goal?”
…our trained AI will actually ask clarifying questions first, helping you sharpen your objective before suggesting survey content - just like an expert researcher would.
The AI will guide you until you have a clear, well-formed objective - then it will build the survey structure around it.
✔ Why Research Goals Matter
Your objective determines:
-
What questions you need
-
Who your audience should be
-
Whether you need screening questions
-
Which analysis will be meaningful
-
How confident you can be in the insights
A vague goal leads to vague data.
A specific goal leads to actionable insights.
✔ Strong vs. Weak Research Goals
Examples...
| Weak Goal | Improved, Actionable Goal |
|---|---|
| Evaluate customer satisfaction. | Identify top dissatisfaction drivers among new users within 30 days. |
| Understand shopper attitudes. | Discover which three product attributes most influence purchase decisions among frequent Target shoppers. |
✔ Pro Tip
Write this sentence first:
“I need this survey to help me decide ________.”
If you can’t fill in the blank, lean on the Pollfish AI Survey Builder to help you clarify.
Help Define My Research Goals →
2. Choose Your Audience First (Pollfish Expert Recommendation)
Many DIY researchers jump straight into writing questions, but even the best survey questions won’t help if you’re speaking to the wrong people.
Our research experts recommend choosing your audience first.
Why?
Because your audience determines:
-
Which questions make sense
-
Whether you need screening questions
-
How much context respondents already have
-
Whether your research goal is feasible
✔ Pollfish Targeting Options
Pollfish provides powerful targeting criteria to connect your survey with the precise audience you need - streamlining your research and eliminating the need for extensive screening questions.
You'll find a wide range of targeting criteria, including:
-
Demographics (age, gender, income, ethnicity)
-
Geography (country, region, state, DMA, ZIP)
-
Consumer Lifestyle (ailments, hobbies & interests, vehicle ownership, streaming activity, travel)
-
Employment (employment status, industry, job title)
-
Behavioral Data (verified purchasers and shoppers by retailer, category, and brand, as well as visitors to specific websites)
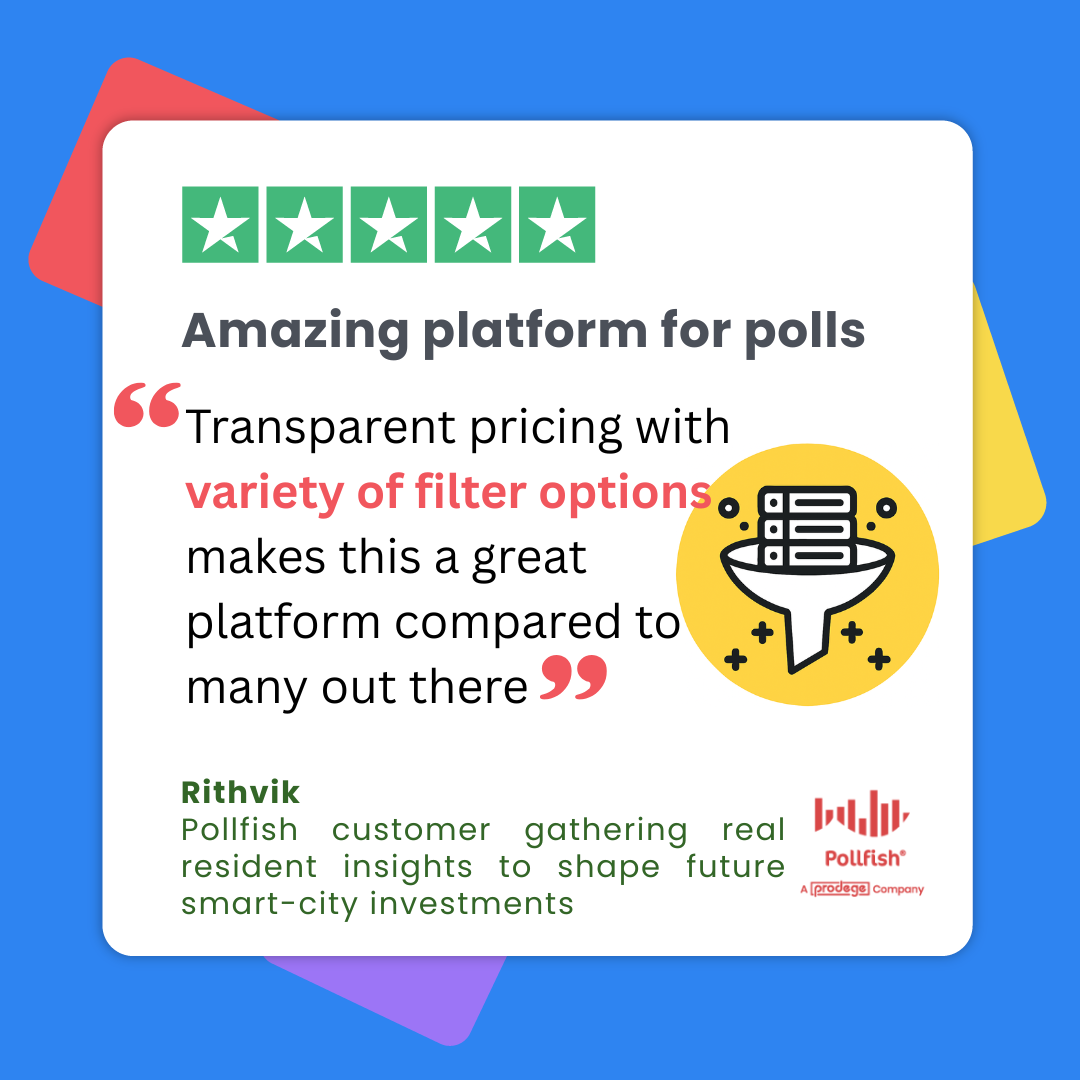
By clearly defining your audience, you ensure your insights are drawn from the most relevant population, improving the quality and relevance of your responses. As this Pollfish customer commented on Trustpilot:
3. Add Screening Questions When Necessary

If the built-in Pollfish audience targeting isn’t enough for your project, screening questions help ensure you reach the right respondents.
But they must be used correctly - otherwise they introduce bias or confuse participants.
✔ Screener Best Practices
-
Always place screeners at the very beginning of the survey. (Pollfish allows for up to 6 screening questions per survey)
-
Use blinded questions so respondents don't immediately recognize the target audience you're seeking and alter their answers to qualify (example below)
-
Avoid Yes/No formats - use frequency or multi-select instead
-
Use platform logic to automatically terminate respondents who don't qualify based on their answers.
-
Consider adding a friendly congratulatory note after the final screener to improve the respondent experience, such as: “Congrats, you've qualified for this survey”
✔ Example Screener (Poor → Better)
Poor: “Do you like pizza?”
Better (Blinded): “Which of the following describes how frequently you order the following items...?" (with options for Tacos, Burgers, Pizza, Sushi etc, on a frequency scale)
A helpful reference for screening questions: How to use Screening Questions like a pro
💡Using the Pollfish Audience for your project? We'll review your survey before launch to ensure your setup gets the results you need.
4. Write Clear, Concise, Unbiased Questions
Question quality directly determines data quality.
Here’s how to write survey questions that produce actionable insights, without confusing or influencing respondents.
✔ Follow the 3 C’s of Effective Survey Design
Clarity - Write questions that are easy to understand. Use simple language. Avoid jargon, acronyms or technical language.
Conciseness - Shorter surveys = higher completion rates. Aim for under 30 questions.
Communication - Every question should tie directly to your goal. If a question won’t be used in your analysis, remove it.
✔ Follow a logical flow
Structure your survey like a story - move from general topics to more specific ones. For instance, you might start with broad questions about shopping habits before diving into topics related to a specific product.
- This avoids "tipping off" respondent to the survey's core objective too early, which helps prevent biased responses.
- It creates a natural and logical progression of questions, making the experience more comfortable and intuitive for the respondent.
✔ Use the right question types
Pollfish supports many question formats, including:
- Multiple Choice (Single Selection): Used when a respondent can choose only one response. This is best for scale questions or identifying favorites and most important attributes. Always include options for 'Other' or 'None' if your answer list is not exhaustive to avoid forcing respondents into an inaccurate choice.
- Multiple Choice (Multiple Selection): Allows respondents to choose more than one response. You can also limit the number of selections (e.g., "Pick the top three"). Always include options for 'Other' or 'None' if your answer list is not exhaustive to avoid forcing respondents into an inaccurate choice.
- Rank Order: Enables respondents to list items in order of preference or importance.
- Likert Scale: A common format where respondents rate their level of agreement or disagreement with a series of statements on a scale (e.g., Strongly Agree to Strongly Disagree).
- Matrix Questions: Collects data on two or more variables at once, often displaying multiple items to be rated using the same Likert scale format.
- Open-Ended Questions: Allows for free-form text responses, providing qualitative data. These should be used sparingly, as they are more taxing for respondents and take longer to analyze. It is best to place them about three-quarters of the way into the survey to avoid early fatigue.
- Numeric Open-End: Prompts the respondent to provide a specific numeric value. It's best to use recent time frames and ask for whole numbers to make recall easier.
- Drill Down: Simplifies long answer lists for respondents. For example, instead of a single long list of cities, you can have respondents drill down from region to state and then to their city.
✔ Avoid common pitfalls
Just as important as knowing what to do is knowing what not to do. Avoiding these common pitfalls will protect the integrity and validity of your data.
- Biased and Leading Questions: These questions subtly encourage a desired response, which undermines the validity of your results. Always strive for neutral phrasing.
- Biased: "How wonderful was your experience with our customer service team?"
- Neutral: "How would you rate your experience with our customer service team?"
- Absolute Words: Avoid using words like 'always', 'every', or 'never'. These words force respondents into extreme choices and can decrease the accuracy of their responses.
- Double-Barreled Questions: These are questions that ask about two separate sentiments at once (e.g., "How satisfied are you with our website and social media?"). This results are useless because you cannot know which item the respondent is referring to. Always split these into two separate questions.
- Unnecessary Questions: Briefer surveys provide better results. Don't add extra questions that won't be used in the final analysis. Every question should have a clear purpose.
- Distracting Formatting: Avoid unusual capitalization or spelling errors. Inconsistent design can distract the respondent from the intent of the question.
5. Improve Respondent Experience & Data Quality
✔ Use visuals for clarity
Accompanying your questions with images or videos can be an excellent way to add interest and clear up any potential confusion. Say you want to gauge consumer sentiment about a new product design, it's far more effective to show an image of the new smartphone and ask what a respondent would be willing to pay for it, than to describe it in a long block of text.
Images and videos help with:
- Concept tests
- Product design evaluations
- Ad tests
- Pricing or packaging studies
✔ Add control measures
- For longer surveys (15+ questions), consider inserting a quality control question in the middle of the survey to ensure respondents are actively engaged and paying attention. A simple instruction like, "To show you're paying attention, please pick the third selection in this list of options," can help identify inattentive participants.
- Include at least one open-ended question as a secondary quality control measure.
- As standard Pollfish automatically reviews, removes and replaces any low quality responses to your survey.
You can learn more about our data quality certifications, controls and processes here
6. Test, Review, and Validate Before Launch
Before launching to your full audience, you should always test your survey.
A fresh pair of eyes can help here. Ask colleagues to preview the survey to catch any overlooked errors. And also review any routing logic and skip patterns. The easiest way is to invite colleagues to join your Pollfish Team (you can have unlimited team members, completely free) and have them preview the survey there.
7. Launch With Confidence
Once you're happy with your survey design, you can go ahead and checkout - which submits your survey for approval to our expert team.
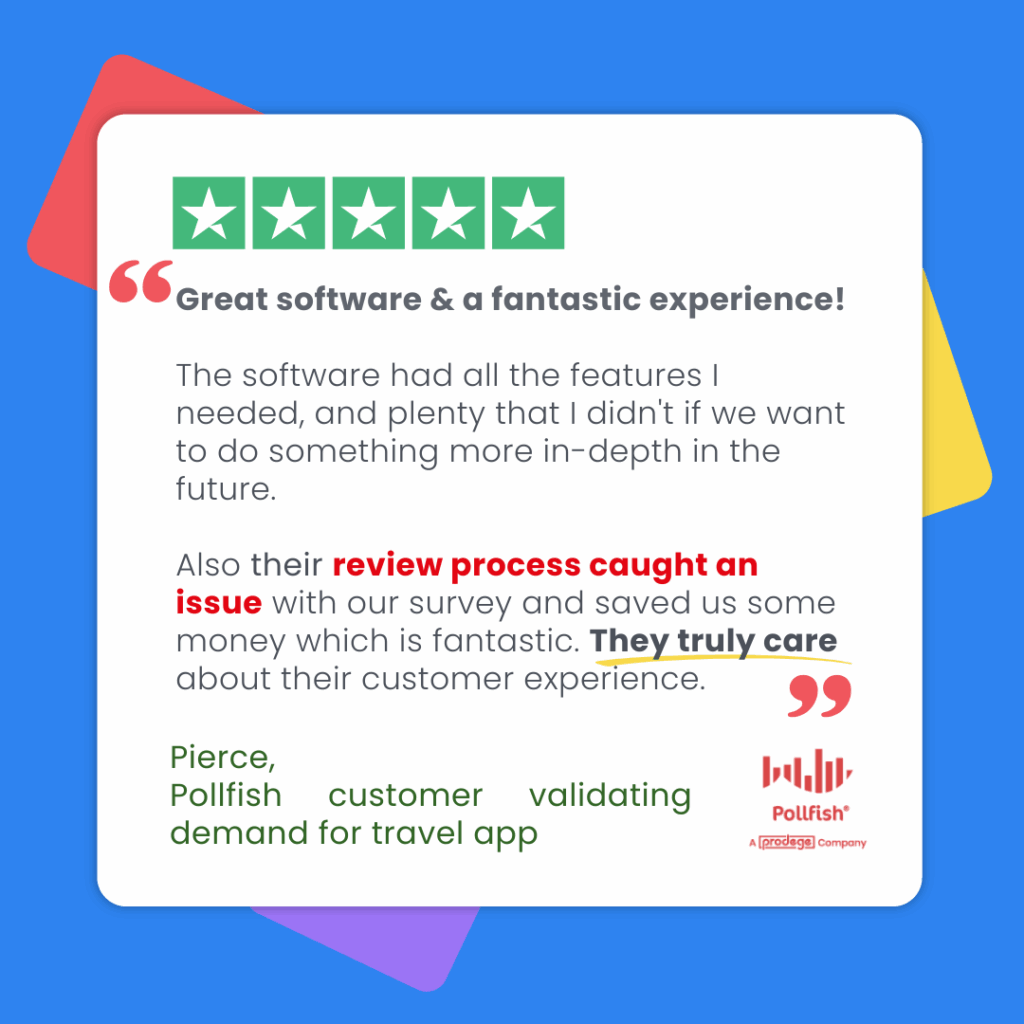
To ensure quality, all Pollfish surveys undergo a manual quality review by our research operations team who check for:
-
Biased wording
-
Over-targeting
-
Feasibility issues
-
Problematic logic
-
Poor respondent experience
-
Designs that may skew results
If we spot any risks, we notify you before the survey fields - giving you the opportunity to review, revise and save your project from any costly mistakes.
8. Analyze Your Results With Pollfish AI
If you want to see insights, not just spreadsheets, then Pollfish’s Data Visualization service can help. It transforms complex data into clear, impactful insights for key decision makers. Our platform updates in real-time with data collection, providing fast results and adding confidence with verified behavioral data.
Easily create presentations with automatic chart creation and data updates, exportable into your custom, editable PowerPoint templates.
This collaborative approach ensures stakeholders can quickly and effectively understand critical insights without getting lost in spreadsheets.
Conclusion
Thoughtful, strategic survey design is the most effective path to generating insights that drive better business decisions. From setting clear goals and defining your audience to meticulously crafting each question and leveraging powerful platform tools, every step in the process contributes to the final quality of your data. By embracing these best practices, you can ensure that your research is not just informative but also reliable, actionable, and a true strategic asset for your organization.
 Live Expert Support
Need help? Have questions? Can't find a feature?
Click the chat bubble in the bottom right of your dashboard to get live, expert support 24/7.
Real humans to support your research goals. All day, every day.
✅ Ready to Dive In?
Head to your dashboard and start exploring Pollfish.

Multiple Open-Ended Question Type
Ask richer questions. Get deeper answers.

We’ve just launched the brand new Multiple Open-Ended question type on Pollfish - giving you more power to collect unstructured insights in a structured way.
Think of it as a matrix-style question, but instead of asking for ratings or numbers, you’re giving respondents the space to write out their thoughts. This makes it perfect for branding questions, concept feedback, and anything that benefits from qualitative input - all while keeping responses neatly organized.
What is a Multiple Open-Ended question?
It’s a flexible matrix question where each cell is an open text field, not a number or scale. You set a main question, define statements (rows), and optionally scale points (columns) - and your respondents can type a response for each cell.

Why use it?
Let’s say you're a brand marketer and want to ask:
“What are your favorite cereal brands?”
Rather than just one long open-end field, you can break it down into 3 or more shorter fields. Or go deeper:
“Where do you like to shop?”
For Shoes: (3x open ends)
For clothing: (3x open ends)
etc
It’s structured and open. So you get specific feedback that’s easier to compare, without losing the nuance of free-text responses.
Key Features
-
Scale point labels are optional – Use them if you want column headers, skip them if not.
-
Statement labels required only when there’s more than one – Keep it clean and simple when needed.
-
Input field sizes – Choose from Small, Medium, or Large to match your question intent.
-
Orientation control – Display fields vertically or horizontally depending on layout preference.
-
Character limits – Set a min/max (2–500 characters) for each input field independently.
-
Matrix logic compatibility – Use carry forward, batch input, and answer shuffling just like with other matrix types.
When to use Multiple Open-Ends
We had clients ask us to develop this feature for use cases such as...
-
Brand recall: “What brands come to mind for each of these categories?”
-
Product feedback: “Tell us what you liked or disliked about each feature.”
-
Shopping habits: “List your go-to stores for each item below.”
-
Creative testing: “How would you describe each concept in one sentence?”
Ready to try it?
You’ll find Multiple Open-Ended questions under the question types button when you add a question to your next survey. Customize it to match your research needs and start gathering richer, more insightful feedback today.
Got questions? Drop us a line on the live chat or explore more how-tos at Pollfish School.

How to Develop a PR Market Research Study
How to Develop a PR Market Research Study

A PR market research study couples two business concepts that appear unlikely to be linked together. After all, PR and market research have maintained a steady distance from their business cousins, known as advertising and digital.
As such, PR and market research are not known to be typically used in tandem, if used together at all.
However, given all the changes in market research over the past several years, from the possibility of agile research, to the emergence of mobile market research and the advancement of data democratization, the realm of PR has much to gain from conducting a market research study.
Much of these changes in the market research sector have already been detected by PR professionals, 58% of which believe that technology will drive considerable change to the PR industry.
In addition, the global PR market is forecasted to grow by 5% by the end of 2026, chiefly due to to the growth of mass media channels.
With technology and innovation acting as the chief drivers behind market research progress, the PR industry can feasibly take advantage through the use of a PR market research study.
This article explores the PR market research study, its use, benefits and how to develop and promote one for your business or PR agency.
Understanding the Meaning of a PR Market Research Study
Market research has extended into all subsets of marketing and business practices. You’re probably familiar with or at last heard of how to do market research for a business plan. A PR market research study essentially takes this concept and implements it for PR purposes.
As its name suggests, this is a kind of market research study designed to extract primary data to support public relations campaigns. This involves empowering a range of PR intelligence and campaign requirements.
How a PR Market Research Study Works
This kind of study is conducted to use the research results that you garner for broadcasting, whether it is for press releases, company outreach, branded content, blogs, news sites and other media outlets, including print.
You can conduct a PR market research study through various market research techniques, including secondary research sources such as industry blogs, news sites, statistics sites and more.
No market research campaign is complete without conducting primary research, as this form is the most unique to a brand, along with being the most relevant, precise and up-to-date kind of research.
This is because, given that primary research is self-conducted, the business or PR agency wields complete control of the study. As such, the party conducting the study decides the topic at hand, the direction of the market research campaign, the types of survey questions, the specifications of the target market sample and virtually all else.
You can conduct a PR market research study through custom PR surveys. A DIY survey leads the way in innovation when it comes to performing market research for PR purposes. This is because it accelerates the survey completion process, allowing anyone to conduct a survey rather than relying on a firm via the syndicated research method.
When you run a DIY survey campaign on a strong online survey platform, you won’t sacrifice speed for quality, as a strong platform offers various quality checks to stamp out low-quality data and survey fraud.
The Importance of a PR Market Research Study
This study helps gain critical insights for a wide array of public relations needs. As such, it carries importance for various PR efforts, fulfilling the needs of companies’ in-house PR teams, along with those of PR firms.
When it comes to pitching branded content, a press release or any other PR content to media outlets, a PR market research study allows you to gain all the insights you need on any demographic. This way, your brand can forge compelling storytelling and much-needed content for your company, the kind that captures the attention of journalists, bloggers and other media mavens within your niche.

This allows you to maximize the effectiveness of your pitch and press efforts, given that this kind of study aids you with credible data to reel in the attention of your desired publication, support your claims, make headlines and build brand trust.
There are also various efforts a PR market research study can assist with when it comes to planning a new project. This involves gaining insights on how competitors are faring in their PR efforts and their brand equity, how to perform on different channels including traditional and social media and how to tinker with your messaging to frame your brand in the best possible light.
A PR market research study allows you to measure existing attitudes from your target market in regards to your brand. This also helps put your brand awareness and brand visibility into perspective.
When examining the attitudes, opinions and perceptions of your target market or even the public, you can track how these aspects have changed before, during and after a campaign to understand its effects. This will help you decide whether to continue with a campaign, change its course or end it completely.
You can A/B test the communications you intend on releasing, whether it is for forming the basis of a PR story, the images you seek to test or the opinions on the statistics you’ve gathered from an earlier market research study.
These PR elements, along with any others you seek to test or survey your respondents on, are vital to the success of your PR campaign. Thus, a PR market research study benefits your business in regards to all of your PR efforts, as the data you extract can inform your ongoing PR efforts and support new ones.
How to Develop and Promote a PR Market Research Study
Performing a PR market research study is not as difficult as it may appear to be. By following instructions in a step-by-step fashion and using a strong online survey platform, the kind that allows you to make your own survey in three simple steps, you can establish an insight-driven PR market research study.
The results of a well-planned PR survey will enable you to produce the media placements you seek, as many news outlets are keen on publishing B2C and B2B survey results. The media is especially bent on publishing controversial survey results, as these kinds gain more reach and therefore media coverage.
However, there are some survey reports that generate little to no publicity. As such, the reporters and editors you pitch to will discard your media pitches. This is because not all survey studies manage to obtain media attention, especially from the companies that don’t frame their results properly.

A PR market research study helps you prevent rejections, by testing your post-survey findings via the aforementioned A/B testing and other surveys. The following provides the steps you ought to take to develop and promote a PR market research study
- Find a topic or issue that you would like to study.
- This will serve as the basis of your market research study. Make sure that your topic is culturally and thematically relevant to your industry.
- Come up with a few key questions you need answers to, especially as they relate to the topic of your study. These preliminary questions should involve your niche.
- Maintain a study topic and questions as original as possible.
- You should attempt to frame them to extract compelling results, the kind that sparks media attention.
- For example, you can frame your findings as follows: “25% of readers are unhappy with the fashion industry and seek more relatable models.” This headline points out a problem, one that your business can potentially fix, which you can include later in your content.
- Choose a potent online survey platform and a survey research method.
- You ought to opt for a DIY survey, as aforementioned. This will grant you speed to insights and grant you full control over the PR market research study.
- Online surveys tend to be a cost-efficient method for running your business survey.
- Make sure you use the correct survey sampling size.
- This will ensure accuracy within your studied population and statistical significance.
- The platform you use should assist you with this with a sample size calculator.
- Promote your PR survey study.
- You can do so via direct mail, PR, social media and online advertising to promote the survey for its intended respondents. In order to do this, your survey platform will need to offer the Distribution Link feature, which allows researchers to send individual surveys to specific people, rather than being mass-deployed.
- You can also advertise the survey on websites, especially those that you would want to publish the survey results.
- Consider using survey incentives.
- These can be either monetary or monetary.
- Depending on the online survey platform you use, some incentives may exist within a mobile game or app. As such, the prizes you can award to respondents who complete your survey would exist in their game or app, such as points, lives, extra time, etc.
- Analyze your survey results.
- You can do so by filtering data options available on your survey platform.
- Do not exaggerate or misuse the findings. Otherwise, your brand will lose credibility and will mar its reputation, since your data will be illegitimate.
- Survey publicity won’t work when it misleads or downright lies about results.
- Try to look for interesting results that your industry may not have expected.
- Mull over relevant and news-worthy pitch angles and headlines.
- Write an outline of your story with your headlines in mind.
- Write a pitch based on your story content. Consider two or more versions of it.
- Run another survey to see which version your respondents find the most interesting and compelling.
- Make sure your survey doesn't have duplicative information.
- Conduct secondary research to assure your competitors haven’t released similar findings and stories. These won’t generate demand from media outlets or readership.
- If your survey resembles a competitor’s, conduct another one that is either more in-depth, or covers another topic.
- Contact the media.
- Have a list of media contacts you’d ideally like to get in touch with to publish your findings and/or their PR assets.
- Provide a high-level description of your study survey so that they open your email pitch.
- Ask if they are interested in surveys and if they prefer to see the raw results or your writeup of them.
- Highlight the main points in your pitch.
- Summarize a few key findings that deal with a specific business issue is a favorable approach for increasing your chances of landing media coverage.
- Don’t put off reporters by sending raw data.
- However, some outlets may require submitting the complete survey data for review.
- Keep product promotion to a minimum if you must mention it at all.
- Pitches that are overly self-promotional are unlikely to convince journalists to use your pitch.
- Lead your story with an unexpected statistic, even if it doesn’t fully bolster the sponsor’s key message.
- Include promotional content further down in the news release.
- Take part in as many other promotional activities as possible.
- Doing so will generate attention, brand awareness, interest and leads.
- Write an op-ed; this kind of asset has the prowess of swaying opinions. In addition, there are online media channels that distribute op-eds.
- Blog about the findings/ PR asset on your website.
- Create social media posts touting your findings.
- Reach out to social media influencers to post about your results. You should ask them to link to your blog, op-ed or other PR content asset.
Meeting All PR Expectations
You can meet all of your PR expectations by conducting a PR market research study. Such a study will grant you unique insights you can use to churn out PR content and learn which kind of stories and assets resonate with respondents the most.
In order to adequately run this kind of study, you’ll need to use the proper online survey platform. While there are many such survey platforms, choose the one that offers the most capabilities.
For example, you ought to use the kind that operates on random device engagement (RDE) sampling, allowing you to reach respondents in their natural digital environments, which reduces various kinds of survey bias.
You should also opt for an online survey platform that implements artificial intelligence and machine learning to disqualify survey fraud and poor-quality data and provides a mobile-first approach design.
An online survey tool with these functionalities will allow you to carry out all PR market research studies and other market research campaigns, at speed and at scale.
What is Experimental Research & How is it Significant for Your Business
What is Experimental Research & How is it Significant for Your Business

Experimental research uses a scientific method for conducting research, employing the most methodical research design. Known as the gold standard, it involves performing experiments to reach conclusions and can be conducted based on some of the findings from previous forms of research.
Logically, it would follow correlational research, which studies the relationships between variables. It can also follow causal research, a kind of experimental research in itself, as it establishes cause and effect relationships between previously studied variables.
Experimental research is typically used in psychology, physical and social sciences, along with education. However, it too can be applied to business.
This article expounds on experimental research, how it is conducted, how it differs from other forms of research, its key aspects and how survey studies can complement it.
Defining Experimental Research
Experimental research is a kind of study that rigidly follows a scientific research design. It involves testing or attempting to prove a hypothesis by way of experimentation. As such, it uses one or more independent variables, manipulating them and then using them on one or more dependent variables.
In this process, the researchers can measure the effect of the independent variable(s) on the dependent variable(s). This kind of study is performed over some time, so that researchers can form a corroborated conclusion about the two variables.
The experimental research design must be carried out in a controlled environment.
Throughout the experiment, the researcher collects data that can support or refute a hypothesis, thus, this research is also referred to as hypothesis testing or a deductive research method.
The Key Aspects of Experimental Research
There are various attributes that are formative of and unique to experimental research in addition to its main purpose. Understanding these is key to understanding this kind of research in-depth and what to expect when performing it.
The following enumerates the defining characteristics of this kind of research:
- It includes a hypothesis, a variable that will be manipulated by the researcher along with the variable that will be measured and compared.
- The data in this research must be able to be quantified.
- The observation of the subjects, however, must be executed qualitatively.
- It can be conducted in a laboratory in field settings, i.e., field research.
- The latter is rarer, as it is difficult to manipulate treatments and to control external occurrences in a live setting.
- It relies on making comparisons between two or more groups (the variables).
- Some variables are given an experimental stimulus called a treatment; this is the treatment group.
- The variables that do not receive a stimulus are known as the control group.
- First, researchers must consider how the variables are related and only afterward can they move on to making predictions that can be tested.
- Time is a crucial component when putting forth a cause-and-effect relationship.
- There 3 types of experimental research:
- Pre-experimental research design
- True experimental research design
- Quasi-experimental research design
The Three Types of Experimental Research
Experimental research encompasses three subtypes that researchers can implement. They all fall under experimental research, differing in how the subjects are classified. They can be classified based on their conditions or groups.
Pre-experimental research design:
This entails a group or several groups to be observed after factors of cause and effect are implemented.
- Researchers implement this research design when they need to learn whether further investigation is required for these particular groups.
- Pre-experimental research has its own three subtypes:
- One-shot Case Study Research Design
- One-group Pretest-posttest Research Design
- Static-group Comparison
Quasi-experimental Research Design
Representing half or pseudo, the moniker “quasi” is used to allude to resembling true experimental research, but not entirely.
- The participants are not randomly assigned, rather they are used when randomization is impossible or impractical.
- Quasi-experimental research is typically used in the education field.
- Examples include: the time series, no equivalent control group design, and the counterbalanced design.
True Experimental Research Design
This kind of experimental research design studies statistical analysis to confirm or debunk a hypothesis.
- It is regarded as the most accurate form of research.
- True experimental research can produce a cause-effect relationship within a group.
- This experiment requires the fulfillment of 3 components:
- A control group (unaltered) and an experimental group (to undergo changes in variables)
- Random distribution
- Variables can be manipulated
Why Your Business Needs Experimental Research

There are various benefits to conducting experimental research for businesses. Firstly, this form of research can help businesses test a new strategy before fully engaging in/ launching it.
The strategy can involve anything from content marketing strategy, to a new product launch. This is especially useful for technology companies, which conduct experimentation frequently. In fact, this kind of research is essential to an R & D (research and development) department.
This makes experimental research a much-needed effort when it comes to spurring innovation. Whether it involves a slight rebranding or an upgrade of products, experimental research guides these campaigns in a science-backed manner.
Secondly, a business must excel in meeting customer needs. Customer experience is an overwhelmingly important side of any business, as customers are willing to make on-the-stop purchases and pay more for a good CX.
As such, each product addition and change in a customer journey must be carried out wisely. Businesses ought to avoid creating unwanted services, or those that cause any aversion within customers. Instead, they should only invest in the most profitable services, products and experiences, a feat that cannot be accomplished solely on guesswork.
Experimenting allows brands to understand customer preferences and changes in their behaviors, as the experiments create stimuli and changes in independent variables.
Additionally, experimental research helps companies better understand their business environment, from customer needs and preferences to the conditions of different markets and locations across regions. In turn, this helps them predict outcomes, or create hypotheses about outcomes to guide them in further research, if need be. For example, a business may consider testing the reactions of its competitors should it raise its costs on various offers.
Aside from discovering if this yields a profitable change, it can discover how companies in the same niche respond and if those responses drive more sales, etc.
Key Independent Variables
- Prices
- Digital user experience (DX) such as new site features
- Advertisements
- Marketing activity (SEO, SEM, social media announcements, retargeting, etc.)
- Season
- Inventory (new products or upgrades)
- Interactions with sales agents
Key Dependent variables
- Sales
- Demand
- VoC feedback (whether positive or negative)
- Site traffic
- In-store visits
- Revenue
- Time spent on a website, bounce rates, etc.
An Example of Experimental Research for Business
Market researchers can apply experimental research to a wide breadth of testing needs. Virtually anything that requires proof, confirmation, or is clouded by uncertainty can put experimentation into practice.
The following is an example of how a business can use this research:
A product manager needs to convince the higher-ups in a denim company to launch a new product line at a particular department store. The objective of this launch is to increase sales, expand the company’s floor presence and widen the offerings.
The manager has to prove that this line is needed in order for the company to pitch the idea to the department store. The product manager can then conduct experimental research to provide a strong case for their theory, that a new line can raise sales.
The product manager performs experimental research by executing a test in a few stores, in which the new line of denim is sold. These stores are varied in location to signify the target market sales before and after the launch. The test runs for a month to determine if the hypothesis (the new line resulting in increased attention and sales) can be proven.
This represents a field experiment. The product manager must heed the sales and foot traffic of the new product line, paying attention to spikes in revenue and overall sales to justify the new line.
Experimental Research Survey Examples
Survey research runs contrary to experimental research, unlike the other main forms of research such as exploratory, descriptive and correlational research. This is because the nature of surveys is observational, while experimental research, as its name signifies, relies on experimentations, that is testing out changes and studying the reactions to the changes.
Despite the contrast of survey research to experimental research, they are not completely at odds. In fact, surveys are a potent method to gain further insight into an existing experiment or understand variables before conducting an experiment in the first place.
As such, businesses can adopt a wide variety of surveys (using market research) to complement their experimental research. Here are some of the key forms of surveys that work in tandem with experimentation:
- The quantitative survey
- Discovers the aspects of statistical significance within variables.
- Helpful in that causal research is quantitative in essence.
- The retrospective survey
- Delves into past events, occurrences and attitudes in regards to the variables.
- Shows whether the variables changed and how so.
- The prospective survey
- Can find causative elements between variables over a period of time.
- Useful for formulating hypotheses.
- The customer experience survey
- Helps businesses zero in on variables that contribute to or result from certain kinds of customer experiences.
- Allows businesses to test CX in relation to the responses from this survey.
- The pulse survey
- Measures various matters critical in a business or organization; surveys employees.
- Deployed more frequently, so variables can always be continually tracked.
- The qualitative survey
- Helps answer the what, why and how with open-ended questions.
- Extracts key high-level information in depth.
How Experimental Research Differs from Correlational, Exploratory, Descriptive and Causal Research
Experimental research differs from exploratory, descriptive and correlational research in self-evident ways. It is, however, often conflated with causal research. However, they too have notable differences.
Causal research involves finding the cause-and-effect relationships between variables. Thus, it too employs experimentation. However, this means that causal research is a form of experimental research, not the other way around.
Experimental research, on the other hand, is fully science and experiment-based, as it chiefly seeks to prove or disprove a hypothesis. While this largely involves studying independent and dependent variables, as it does in causal research, it is not solely based on these aspects. Instead, it can introduce a new variable without knowing the dependent variable or experiment on an entirely new idea (as in the example used in the previous selection).
Causal research looks into the comparison of variable relationships to find a cause and effect, while experimental research states an expected relationship between variables and is bent on testing a hypothesis.
As far as comparisons to correlational research go, while experimental research also studies the relationships between variables, it functions far beyond this by manipulating the variables and virtually all subjects involved in experiments.
On the contrary, correlational research does not apply any alterations or conditioning to variables. Instead, it is a purely observational research method. As such, it merely detects whether there is a correlation between only 2 variables. In contrast, experimental research studies and experiments with several at a time.
Exploratory research is vastly different from experimental research, as it forms the very foundation of a research problem and establishes a hypothesis for further research. As such, it is conducted as the very first kind of research around a new topic and does not fixate on variables.
Descriptive research, like exploratory research and unlike experimental research, is conducted early in the full research process, following exploratory research. Like exploratory research, it seeks to paint a picture of a problem or phenomenon, as it zeros in an already-established issue and delves further, in pursuit of all the details and conditions surrounding it.
Thus, unlike experimental research, it only observes; it does not manipulate variables in any capacity or setting.
The Advantages and Disadvantages of Experimental Research
Experimental research offers several benefits for researchers and businesses. However, as with all other research methods, it too carries a few disadvantages that researchers should be aware of.
The Advantages
- Researchers have a full level of control in an experiment.
- It can be used in a wide variety of fields and verticals.
- The results are specific and conclusive.
- The results allow researchers to apply their findings to similar phenomena or contexts.
- It can determine the validity of a hypothesis, or disprove one.
- Researchers can manipulate variables and use them in as many variations as they desire without tarnishing the validity of the research.
- It discovers the cause and effect among variables.
- Researchers can further analyze relationships through testing.
- It helps researchers understand a specific environment fully.
- The studies can be replicated so that the researchers can repeat their experiments to test other variables or confirm the results again.
The Disadvantages
- It involves a lot of resources, time and money, as such, it is not easy to conduct.
- It can form artificial environments when researchers unwittingly over-manipulate variables as a means of duplicating real-world instances.
- It is vulnerable to flaws in the methodology, along with other mistakes that can’t always be predicted.
- Flawed experiments may require researchers to start their experiments anew to avoid false calculations, measuring results from artificial scenarios or other mistakes.
- Some variables cannot be manipulated and some forms of research experiments are too impractical to conduct.
How to Conduct Experimental Research

Experimental research is often the final form of research conducted in the research process and is considered conclusive research. The following explains the general steps required to successfully complete experimental research.
-
- Identify your research subject, a question surrounding it and its variables.
- Form a specific research question.
- Gather all available literature and other resources around the subject.
- Conduct secondary research around the subject and primary research via surveys.
- If the topic involves a research process you have already begun, for instance in exploratory, descriptive, correlational or causal research type, gather together the facts you already have and hand.
- Consider how they relate to your question and how they line up with the secondary research you conducted.
- After your initial studies, form a hypothesis.
- Design a controlled experiment.
- First, decide which variable(s) is dependent/ independent (if it doesn’t involve experimenting).
- Decide how far to vary the independent variable.
- In the experiment, manipulate the independent variable(s).
- Measure the dependent variable(s) while you study the independent variable(s) alongside.
- Make sure to control potential confounding variables.
- Assign subjects to their designated experimental treatment groups.
- Keep the study size in mind; a larger study pool creates statistical findings.
- Assign your subjects to “treatment” groups randomly, with each to receive a different level of “treatment.”
- Use a control group, which receives no manipulation. This shows you the test subjects as they appear/behave without any experimental intervention.
- There are 2 types of groups for assigning your subjects:
- A completely randomized design vs a randomized block design.
- Completely randomized design: every subject gets randomly assigned to a treatment.
- Randomized block design: aka stratified random design, subjects get first grouped based on a shared characteristic, then assigned to treatments within their groups at random.
- An independent measures design vs a repeated measures design.
- Independent measure: subjects receive only one of the possible levels of an experimental treatment.
- Repeated measures design: every subject gets each of the experimental treatments consecutively, as their responses are measured. It also refers to measuring the effect of an emerging effect over time.
- A completely randomized design vs a randomized block design.
- Continue experimenting on variables as needed, take measurements and take notes.
- Based on your experiment(s), put together a logical conclusion. It is possible that it may need testing over time.
- Identify your research subject, a question surrounding it and its variables.
Using Experimental Research and Going Further
Although experimental research can be very complex, this research method is the most conclusive. Using a scientific approach, it can help you form tests on various business matters. While it is critical for understanding your target market’s and customers’ existing behaviors, it can also be used to experiment on a wide variety of other matters.
Before launching a new product, or an updated one, for example, you can conduct an experiment to understand the product in action. This helps you avoid any glitches or undesirable qualities that will incur problems for your customs and a bad reputation for your brand.
Experimental research is not for every business, yet if you decide to implement this form of research, consider using surveys in tandem. An online survey platform can help you establish and distribute your surveys to a wide network via organic sampling to avoid biases.
Although it isn’t a requirement, in today’s age of excelling in customer experience (CX), it is of the essence to have as much data on your target market as possible. The best survey tools for market research make this possible and they can help you quickly get high quality survey responses.
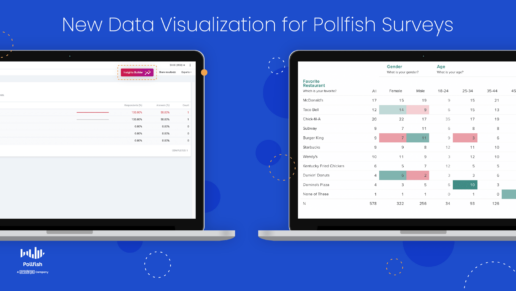
A New Data Visualization Tool for Surveys
Meet Insights Builder, the New Data Visualization Tool for Pollfish Surveys

Want an easier, more colorful way to analyze and present your Pollfish survey data?
Look no further! With our new integration to the Prodege Insights Builder, you can enhance your survey analysis by adding valuable data visualization to your survey data.
Add Data Visualization with a Single Click.
Easily add data visualization to your next survey.
- Open a survey in your Pollfish dashboard.
- Click the “Insights Builder” button.
It really is that simple.
Analyze, Visualize, & Share Results.
With this new data visualization tool, you can:
- Analyze:
- Use a custom interactive online database to display key insights.
- Cross-tabulate, add filter logic, create new variables, apply stat testing.
- Visualize:
- Illustrate your business objectives clearly with visualization techniques.
- Craft rich and easily edited slide visuals in your organization's branding.
- Share:
- Collaborate with your team internally through Pollfish by sharing directly.
- Control access and broadly share with internal and external stakeholders.
How "Insights Builder" Works
Only researchers in the Elite plan can access the Insights Builder tool via the Pollfish interface.
The export to Insights Builder can be initiated per survey by the researchers, but not all surveys are automatically synced. Once initiated, all survey updates (new responses received, new revisions added, survey renames, etc.) are synced in real-time.
First-time survey export
For a survey that has not been synced to the data viz tool, the researcher can view the “Insights Builder” option on the survey menu and the results page. A new window will ask you to continue, which will then redirect you to a new tab, once you click it.
This action will:
- Place the survey data into the data visualization tool.
- Open a new tab in your browser; this will contain the data visualization folder created for a specific survey.
- This means you can return to Pollfish whenever you wish.
- It will authenticate you to the data visualization tool via your Pollfish account, seamlessly.
- You won’t be asked to log in with your credentials to Data Viz.
- The “Insights Builder” is an option available throughout the lifecycle of the survey (from the status of running to paused/ completed/ finished).
Viewing an exported survey:
- When a survey has been synced to the tool, you can view the “Insights Builder” option in the survey menu and on the results page.
- A loader screen will appear to redirect you to a new tab.
Get Started With Data Visualization Now
Ready to get started?
Log into your account and try it out!
Your support doesn't stop here. Prodege can provide additional support around leveraging data visualization with your Pollfish surveys and for all sorts of additional insights needs.

How to Leverage Data from Conjoint Analysis Exports
How to Leverage Data from Conjoint Analysis Exports

Let’s take another critical dive into conjoint analysis, a super informative market research feature that we released last year.
As you know, a Conjoint Analysis is a kind of tool and research technique that enables you to measure the value that consumers place on the individual features of a product or service.
This kind of analysis is particularly beneficial for product and pricing research, as it unveils a plethora of consumer preferences. You can then use this information to optimize your products and services.
In this article, we specifically focus on Conjoint Analysis exports on the Pollfish platform.
The Polfish market research platform generates optimized Excel, CSV and SPSS files that contain raw data, which you can use to form your own analyses and import the data from the tool to other software.
If you want to run your own Conjoint Analysis to compute and understand part-worth importance, you’ll need to use its export, as it contains raw data from your Conjoint Analysis.
This article teaches you how to do so.
1. How does Pollfish generate the Conjoint Analysis design?
The conceptual model of a conjoint analysis is pretty straightforward; it suggests that the utility of a multi-attributed product can be broken down into specific contributions of each attribute and their interactions.
The approach is easy to implement if the number of attributes is small. However, problems arise because of the large number of possible hypothetical alternatives for a given product.
For practical reasons, only a subset of possible alternatives is chosen for the study. To that end, experimental design methods exist for selecting good subsets of product configurations for performing the analysis.
Respondents will see a subset of possible options to choose from, which depends on the number of attributes and levels defined.
In order to do this, the Pollfish Conjoint algorithm first creates an orthogonal design of the alternatives (product bundles) that are formed by combining the levels of the attributes.
In the case that all possible combinations are more than 20, the total number of alternatives gets reduced using d and g optimality criteria.
Then choice sets are created, containing an upper limit of 5 alternatives each. The algorithms that we are using ensure the d-optimality of the choice-set design.
Finally, choice sets are assigned to blocks. One block cannot contain more than 30 choice sets.
The goal for our Pollfish Conjoint algorithm is to ensure that each level in each attribute appears the same number of times and that each alternative appears the same number of times in the design, so that the results have 0 bias and variance.
Each respondent gets assigned to only one block randomly. Blocks are distributed evenly to the audience, so that every choice set in the design is seen by the same number of respondents.
2. How is the Conjoint Analysis design distributed? Via the Pollfish algorithm based on Block Designs
A problem that usually arises when the choice-set design is ready to be administered to a target population is that the number of choice sets in the design may be too large for an individual to assess.
In these cases, a common technique is to partition the choice sets into blocks of equal size, in principle much smaller than the size of the original design, and then administer the blocks to the population.
That way, each individual would have to assess only the choice sets of one block, while collectively the population would assess all the choice sets of interest. However, in order for this partitioning to make sense, some constraints must be satisfied.
Each choice set should be evaluated by the same number of users. That means that each choice set should appear the same number of times into the blocks. Note that it is not necessary for a choice set to appear in all blocks. To that end, we may need to replicate the choice sets in order to always be able to divide them into blocks.
Formally speaking, the following equation should be satisfied: vr=bk
where v is the number of choice sets, and r is the replication factor of each choice set, is the number of blocks and is the size of each block, that is, how many choice sets each individual should see. Thus, given a choice-set design of size, we have to find the three smallest numbers () satisfying the above equality. Given these numbers, we can safely partition choice sets into blocks.
3. Understanding the Excel structure
The Excel (CSV and SPSS) file is a complementary feature of the visualized results at the Pollfish dashboard. It contains all responses given by each respondent of the survey. Graphs on the results page are based on these individuals' responses.
To take advantage of the Excel for a Conjoint Analysis or MaxDiff Analysis survey, visit the results page of a completed one, select “Export results” and choose “Excel” as your export option. You will be sent an email that notifies you when your export is complete. Open the document in Excel or Google Sheets to get started.
The Excel sheet will include the following two (among the other tabs):
- Experimental design tab: This tab contains the Conjoint or MaxDiff’s design, as generated by the Pollfish Conjoint algorithm.
- Individuals tab: This tab contains the selections given to the questions of the survey by each respondent.
For the case of the CSV and the SPSS, the experimental design comes in a separate file.

A. The Εxperimental Design Tab
Let’s assume that we have a Conjoint Analysis survey with the following attributes and levels, describing alternatives of detergents:

In the Excel tab, each component is listed in a column and has a unique ID. Blocks, their containing choice sets and alternatives(or “Concepts”) have their own IDs, as the following screen depicts.

For the specific example, the Pollfish algorithm will generate a design of 4 blocks of 5 choice sets each.


Each choice set contains 5 alternatives (or “Concepts”). Each row represents a generated alternative (or “Concept”), whose containing attribute levels’ columns are located after the “Concept” column (in our example of detergents Conjoint test, the attributes were 4: Type, Perfume, Quantity and Price).

The settings for the number of choice sets and the number of alternatives, are also displayed in the questionnaire while preparing the Conjoint survey:

B. Conjoint selections at the Individuals tab
Each respondent gets only one of the generated blocks. The blocks are evenly distributed across the sample, hence, a block may be received from many respondents.
In our example, from the 120 total sample, each group of 30 respondents will get one of the 4 blocks:
- 30 respondents receive the block with ID 257
- 30 respondents receive the block with ID 258
- 30 respondents receive the block with ID 259
- And 30 respondents receive the block with ID 260
At the Individuals tab, each row represents the responses given to the questions by a single respondent. Data related to the Conjoint Analysis are placed among the other questions contained in the survey and start with the column named “Block” which holds the block ID the respondent received.
Then the choice-set ID columns follow along with the selected alternative (or Concept) ID columns. The choice-set columns are ordered according to the order the respondent received them.
So, ChoiceSet0 ID holds the first choice-set ID the respondent got. Selected Concept 0 ID holds the respondent’s selected alternative ID(or Concept) in the first choice set and so forth until selections for all choice sets are provided in the tab.

C. Correlate the data at both tabs for further analysis
You do so by combining the following:
- the data from the Experimental design tab, which holds the content for each block and their included choice-sets
- the data from the Individuals tab, which hold the selections per respondent
You can then proceed by then analyzing the data in a different system.

How Pollfish Provides Quality Data and Prevents Survey Fraud (2023 Update)
How Pollfish Provides Quality Data and Prevents Survey Fraud (2023 Update)

Pollfish implements a variety of procedures to ensure the highest quality of data. Using a combination of proprietary techniques and machine learning technology, our platform, along with our team of technical experts prevent survey fraud at every turn.
When combined with our rigorous quality checks, our participant pool of over 800M+ enables us to discard responses that don’t meet our quality standards — without sacrificing the sample size. As such, no question is subject to survey fraud, as the Pollfish platform stamps out inaccurate or poor quality responses.
As a result, we deliver higher quality data than our less-selective, panel-based counterparts.
What is Survey Fraud?
Survey fraud, or market research fraud is the adverse phenomenon that occurs when survey respondents submit fraudulent or bogus responses. This can occur accidentally, such as when responders undergo survey fatigue, or purposefully.
What would prompt a responder to partake in the latter? They can be your competitors (especially if the survey mentions your brand or makes it apparent that it is conducted by your brand), bots, click farms, or respondents eager to finish the survey to receive an incentive.
Thus, there are a number of ways respondents can contribute to survey fraud, such:
- Providing nonsensical, i.e., gibberish answers
- Breaking rules
- Answering suspiciously quickly
- Hiding their IP address via the use of a VPN
- Leaving one-word responses in open-ended questions that ask for an in-depth answer
- Flatlining
In regards to the latter, remember the old advice to “just choose B” all the way through if you didn’t study for a test? That would result in an “F” from us. Participants that choose the same answer repeatedly, try to take the same survey again, or attempt to submit multiple surveys in quick succession don’t pass our test.
Natural Language Processing for Open-Ended Answers (New Feature 2023)
Respondent Verification
We further verify by checking ahead for duplicated IDs via IP or MAC addresses, Google Advertising and mobile device identifiers, and we work with our manually vetted publishers to send unique IDs as an added layer of protection. In-survey questions are designed to add another layer of security against survey fraud, such as requesting an answer to a simple math equation or including identical questions within a survey with the response options re-ordered to verify answer consistency.
Zero Tolerance For Bots
In addition, we have zero tolerance for bot-friendly VPNs, incomplete surveys, or other suspicious activities. We reject responses from any behavior we deem questionable—anything from answering open-ended questions with nonsense to attempting to sign in from multiple countries at once. We’re even alerted if respondents are spending an inappropriate amount of time across questions within the survey.
Rigid Adherence to Targeting
Our data quality is second to none. As such, we’re skeptical of just about everyone, and that’s what makes us the best at what we do. Accuracy is our top priority, which is why we are so critical of our sources and their behavior. In fact, we only include respondents that match 100% of the targeting criteria, even if there was nothing fraudulent about their responses. This includes surveys with multiple audiences, as well as those with stringent respondent qualifications, such as specific answers to screening questions. Our combination of technology and expertise ensures the delivery of the highest quality data to our customers—every survey, every time.
Multiple Layers of Quality Checks
Pollfish supports multiple other layers of quality checks. This is an ongoing process since both the platform and our technical experts continuously work to avoid survey fraud while fetching the preset amount of required survey completions with the correct targeting. There are several layers that we use to improve the data quality. These include:
The Technical layer:
- Includes various checks to ensure first-rate data. Hasty answers check: catches respondents who answer faster than the average time required to read the actual questions.
- Reset ID Check: Occurs when the responder answered the same survey previously, but with a different device to avoid the same respondent from partaking more than once.
- Gibberish Check: When the given answers contain text that is considered gibberish, ex: “dsfjkn dfnksj ifjodf”.
- Same IP Participation: Checks if a survey has been completed before within a certain time from the same IP address of the respondent’s device.
- Carrier Consistency: Assures that the carrier of the respondent is contained in the targeting market.
- VPN: VPN users are automatically disqualified from survey participation.
Quality Questions & Responses
Our platform is designed so that your questionnaire is bound to receive quality responses. In order for it to do so, aside from post-answer quality checks, we provide quality answer triggers. Our quality questions include: trap, red herring and attention questions.
- Trap questions: Checks that respondents are paying attention to a command, usually one that asks to select a negative response. Responders with acquiescence bias, or those who choose positive responses will be caught.
- Ex: Please select "Somewhat Disagree" below
- Strongly Agree
- Somewhat Agree
- Somewhat Disagree
- Strongly Disagree
- Ex: Please select "Somewhat Disagree" below
- Red Herring Questions: These check if the respondent is engaged with the survey, tracking how logically they answer oddball questions.
- Which of the following is not a sport?
- Soccer
- Basketball
- Cookies
- Baseball
- Which of the following is not a sport?
- Quality Questions: Checks if respondents are reading and comprehending the question, much like red herring questions.
- Ex: Which of the following does not have wheels?
- Bike
- Car
- Skateboard
- Elephant
- Cart
- Ex: Which of the following does not have wheels?
These are injected within various components in the survey flow depending on each survey’s type to check if the respondents pay attention. Those quality questions are also used in Demographic surveys. If the respondent fails to answer a quality question, a reverse counter is displayed.
Finally, we also check for response quality by banning respondents who provide insufficient quality data from the network. Additionally, our system uses an audit to validate open-ended data to ensure that respondents do not provide inadequate responses. We also have installed a function that wards off copy-pasted answers in open-ended questions and others.