

What Is a Market Research Agency and Do You Need One?
What Is a Market Research Agency and Do You Need One?

When it comes to conducting market research, you may have come upon the term market research agency.
Nowadays, there are agencies for virtually all industries, so it is unsurprising that they exist in the research space. As such, using this kind of agency is one of the many available market research techniques.
The market research industry has more than doubled in revenue since 2008, exceeding $76.4 billion in 2022.
US market research companies have been dominating this space, as they generated over $47 billion dollars in revenue. This means that market research companies in the US yield more than half of the total revenue of the market research industry globally.
But what exactly is this kind of agency in the realm of market research? And how do you know if you may need to utilize its services?
Perhaps, you may need its services, but can make better use of a different method to conduct research on your consumers.
This article expounds on the premise of the market research agency, and its four main types, and compares it with another major method of conducting research to help you determine if you need it.
Defining a Market Research Agency
This is a kind of agency that offers various market research services to its clients. It is made up of a core group of researchers and administrators.
This kind of agency can conduct either quantitative market research and qualitative market research. It may also offer both kinds of research.
These agencies will approach market research in their own manner. Thus, they may offer a specific service, or various services. As such, market research agencies may provide the following services:
- A series of interviews
- Consultancy services
- Workshops
- Focus groups
- A survey campaign
(See the below section to better understand the four main types of these agencies).
A market research agency can exist in the form of a single company, a division of a company, or even an individual who specializes in carrying out market research campaigns.
Such an agency can take different approaches to research, such as a full-service process, fieldwork or only data analysis.
It typically works by gathering and analyzing information about your customers, competitors, vendors and distributors and other people and forces in your industry.
Most of these firms provide services that are commissioned by companies for particular purposes. Many also collect data beforehand and then attempt to sell it to interested parties. Because of this, these firms are part of syndicated research.
The Four Main Types of Market Research Agencies
There are four main types of market research firms. They differ based on the services they focus on and offer to their clients. Understanding these four major forms will allow you to decide whether you need this form of research, along with what specific services are most important for your research endeavors.
Field Service Agency
This kind of agency conducts research with your target market. Focused on data collection, it engages customers at the ground level to gain insights based on a specific question. The methodology it uses involves surveys, interviews, focus groups, observation, and other data collection methods.
The “field” in this agency refers to the act of engaging respondents itself and collecting data.
A field service agency doesn’t design research campaigns or analyze the findings of the research. Their area of focus is specifically on gathering and documenting data.
Also referred to as a fieldwork firm, this agency is typically commissioned by other market researchers that have already begun a research study and use the firm to get data to back up their research.
The field service agency sends the data to the researchers, so that they can then apply it to their studies.
Intercept and Mystery Shopper Agencies
These agencies are specialized field service firms that collect data via real-life interactions with customers. This involves face-to-face interaction with respondents for intercepts along with disguising participants as shoppers who observe customers through mystery shopping.

Mystery shopper firms collect and measure mock customer experience by having participants working as if they were actually paying customers in a transactional environment.
In this way, the firm researches how typical customers of a business experience its brand. The mystery shoppers collect valuable data that can help businesses alter their services and frontline interactions to meet consumer preferences and needs.
This type of market research is useful for brands that seek to observe in-the-moment reactions and engagement of their customers. This is also useful if you’d like to see if the location of business dealings affects the customer experience.
This type of firm may also rely on online intercept tools with mobile availability given the presence of market research tools in the digital world.
Research Report Purveyor
This type of agency aggregates and assembles market research on particular industries, demographics, psychographics and market trends. This tends to include conducting secondary research, or buying data from the other types of agencies aforementioned.
The purveyors put together reports for businesses interested in the data they gathered. A syndicated research approach, the reports from the original study were self-funded using indications that the information will be of interest to different buyers in an industry.
This type of agency is best suited for businesses or other research firms that need broader market data and don’t have the time or resources to invest in custom research.
Full-Service Agency
As its name suggests, this type of agency supplies end-to-end, customized market research services. These services can include the following:
- Identify the research problem to be solved.
- Determine a viable research design.
- Prepare the methods and tools to use in the research study
- These typically involve both online and offline activity such as respondent sampling, survey data collection, various analyses, such as a customer behavior analysis and reporting.
- Implement the insights that were garnered.
- Prepare reports of the findings.
A full-service research firm is often used as a consultant, given that it may also implement the collected data due to the demand for actionable outcomes. In this way, the research is simply a means to other business-related activities they provide.
DIY Survey Research: A Market Research Agency Alternative
When it comes to market research agencies, most businesses and researchers typically use one type of agency or approach, rather than two or more, as this can be expensive and not worth the hassle.
However, some also choose to pair a market research firm with the DIY survey approach. That’s because surveys are invaluable tools of customer insights. Moreover, they can be used to research virtually any audience. That’s why some research firms conduct them.
However, conducting DIY market research is more ideal than relying on a third party to conduct the survey research for you. While surveys offer colossal support, they are only as useful as you make them.

That’s because when you rely on other companies to run your survey campaign, they wield full control over the direction of the survey campaign, including its specific questions and target audience.
It is therefore far more optimal to conduct market research yourself with a DIY survey platform. Such a platform would grant you full control over every aspect of your market research campaign. You can customize it to your liking in various ways, including:
-
-
- The targeting criteria
- The screener questions
- Adding multiple audiences
-
- The questionnaire
-
-
- All of the question types
- The wording of the questions
- The order and logic paths of the questions
- The thank you note and introduction
-
- The dashboard
-
- This includes the survey results dashboard, which you can filter
- You can choose your own imports and visualizations
We recommend using survey research to accompany any market research agency you use to conduct your research campaigns. Specifically, we recommend using a multi-functional survey platform, one that not only creates and deploys surveys, but enables you to carry out various market research efforts, such as conducting a conjoint analysis, pricing research, A/B testing and more.
With such a survey platform, you will get a holistic market research approach, as it allows you to deploy a multitude of survey types, research different business matters and even perform other market research practices.
Because of this, a strong survey platform allows you to replace or entirely forgo using a market research agency. After all, conducting your own surveys is cheaper, faster and more relevant to your particular research needs.
Getting Market Research Right
As per the verdict of this article, it is useful to rely on both market research firms, along with a DIY survey platform.
You can even abandon using a research agency entirely, as survey research grants you all the relevant information for your survey campaign in a timely manner.
However, the efficacy of your survey campaign is highly dependent on the platform you use. You wouldn’t want to gain slow or subpar data.
You should therefore select your market research platform carefully. A strong market research company will allow you to fulfill all of your online market research activities. This includes all the activities mentioned in this article and beyond.
The Pollfish online survey platform allows you to create a thorough survey data collection, one you can customize to your liking, view however you choose and organize to the max.
We offer an advanced method to distribute your survey to millions of random users online via the organic sampling method.
Random Device Engagement (RDE) is a kind of polling that relies on advertising networks and other digital portals on devices, to engage random people where they are, voluntarily.
This way, they won’t feel pressured to answer in a particular way, as survey panelists would, as they are completely anonymous and randomized.
Researchers can reap a wide breadth of information on their respondents and access a wide pool of insights in their survey results dashboard.
We also offer the advanced skip logic feature, which routes respondents to relevant follow-up questions based on their previous answers.
In addition, you can send your survey to specific respondents and on specific digital spaces, by simply using the Distribution link feature. This allows you to post your survey anywhere you wish, along with emailing it to those you want to research.
With such a multi-functional platform, you’ll be able to conduct any market research campaign and gain high-quality data which you can use to take action.

Enrich Your Branding Research with Brand Awareness Survey Questions
Enrich Your Branding Research with Brand Awareness Survey Questions

You’ll need to have a solid collection of brand awareness survey questions in order to run a successful brand awareness survey.
An ideal survey would include a plethora of insights that allow you to gauge how well your target market is able to recognize your brand, along with the degree to which they know of its existence.
We can’t stress the importance of brand awareness enough. Take, for example, the fact that nearly half of all customers tend to buy from familiar brands, at 46%.
Thus, you surely wouldn’t want your products to fall by the wayside due to their lack of recognizability. Instead, you should strive to gain as much brand awareness as possible for all members of your target market and customer personas.
Brand awareness is also a stepping stone to brand trust. Once again, almost half of customers better patronage a brand they trust. That’s because 46% of customers would pay more for a brand they trust.
The more customers recognize, recall, and believe in your brand, the more they will buy from you, growing your retention rate and pool of loyal customers.
Thus, start by creating a strong brand awareness survey with the right questions.
This article lays out a variety of different types of useful brand awareness survey questions and their examples, which you should include in your survey.
The Main Types of Brand Awareness Survey Questions
There is much more to brand awareness than knowing whether or not a brand exists. As such, there are different types of brand awareness questions you can use in such a survey.
You should know each kind — and not merely categorize them. By understanding each type of brand awareness question, you’ll be able to easily ideate them for all your surveys. You’ll also be able to better understand the kind of awareness campaign you’re running.
Let’s first recap on the basics: what is a brand awareness survey?
This is a type of questionnaire that measures how aware your target audience is of your brand in your industry and how it is perceived. There are four major areas that make up this type of survey, as there are four main aspects of brand awareness.
Because of this, you can probably infer that there are four main types of brand awareness survey questions. The thematic makeup of these four question types will guide the types of questions you create.
Here are the four main types of brand awareness survey questions:
- Brand recognition:
- This is a measurement of how familiar your customers are with your brand.
- Brand recall:
- This is the practice of finding out if your brand spontaneously comes to customers’ minds when they think about your product or service.
- Brand identity:
- This seeks to reveal whether customers know about your mission and vision, how well they understand them, and how well they can recognize them.
- Brand image:
- This involves all the associations and ideas people think of when they think about your brand.
With these question types in tow, you have already devised a major part of your survey questions. Consider these types when coming up with your questions, so that you stay organized and understand what aspect of brand awareness exactly you are researching.
Brand Recognition Questions:
- Have you heard of [your brand]?
- Question Type: Yes or no
- How long have you known about [your brand]?
- Question Type: Multiple choice
- Use only if the respondent said yes to the previous question
- Which of the following products does [your brand] offer?
- Question Type: Multiple choice, multimedia elements
- Answers: Options should be the specific products you sell, as well as general products to determine if customers truly know what you sell.
- Where can I buy products/services from [your brand]?
- Question Type: Multiple choice, multiple selection
- Answers: Provide a list of places (including places online) to determine if customers know where and how to purchase from you.
- What do you know about [your brand]?
- Question Type: Multiple choice, single or multiple selection
- Answers: Provide various key facts about your brand and its offerings to see what customers know about it and where you can improve in having them recognize your brand.
Brand Recall Questions:

- What is the first brand you think of when thinking of [product type]?
- Question Type: Multiple choice or open-ended
- Answers: With a multiple choice set, use your competitors along with your brand.
- An open ended field, however, will allow respondents to enter in a brand unaided (chosen entirely on their own as opposed to seeing it as one of the answers). It will also give you the chance to learn about competitors you didn’t know about.
- Why is this the first brand would you consider using when you have [a particular problem that your products solve]?
- Question Type: Multiple choice, multiple selection and open-ended
- Answers: With a multiple choice set, use your competitors along with your brand.
- Again, an open-ended field will allow respondents to list a brand or brands you may have not known about.
- What companies spring to mind when you think of [your industry]?
- Question Type: Multiple choice, multiple selection
- Answers: Use a variety of well-known brands in your answers, along with yours.
- You may also gradually ask about lesser known brands as well.
- Which of the following products would you think of buying first for [a particular problem]?
- Question Type: Multiple choice, single selection
- Answers: These should be of real products including one of yours and the rest of your competitors.
- Which brands from the following list sell [a product in your industry]?
- Question Type: Multiple choice, single selection
- Answers: These should be of real products including one of yours and the rest of your competitors.
- This is aided brand recall, as it asks if respondents recognize your brand from a list of other naemd brands.
Brand Identity Questions:
- Is your brand committed to fighting for or supporting any cause or mission?
- Question Type: Yes or no
- Which causes/values is [your brand] committed to or strongly upholds?
- Question Type: Multiple choice, single or multiple selection
- Answers: Use only if the respondent chose “yes” in the previous question.
- Use a variety of key values or specific causes that your brand strives to uphold and support.
- What ideas/causes do you associate with [your brand]?
- Question Type: Multiple choice, single or multiple selection
- Answers: Use a variety of associations with your brand, along with several that aren’t part of its identity.
- What areas is [your brand] involved in?
- Question Type: Multiple choice, single or multiple selection
- Answers: This can also be any associations you choose, from social causes, to cultures, to regions, etc.
- How well would you rate [your brand’s] commitment to the [social, environmental, other causes/mission]?
- Question Type: Multiple choice, Likert scale question
- Answers: A Likert scale of “extremely well” to “extremely poorly.” This goes beyond recognizing your mission and values, as it allows respondents to rate your performance in regards to them.
Brand Image Questions:

- What style do you think of, when you think of [your brand]?
- Question Type: Multiple choice, single or multiple selection
- Answers: Use a variety of stylistic references that closely describe you, that somewhat accurately describe you, along with those that don’t.
- What parts of [your brand] do we do particularly well/ that you like?
- Question Type: Multiple choice, multiple selection
- Answers: Use a variety of positive aspects you feel to be true about your brand to see whether they are also felt by your respondents.
- How would you describe the feel of [your brand/ a particular product you sell]?
- Question Type: Multiple choice, multiple selection or open-ended
- Answers: Use a variety of adjectives or adjectival phrases about your brand (not all positive) to see which ones customers associate with your brand.
- An open-ended field gives respondents the opportunity to describe what images and associations your brand evokes.
- Which brand comes to mind when you think of [a particular style or quality]?
- Question Type: Multiple choice, single selection or open-ended
- Answers: Use a style or quality you hope people associate with your brand in the question.
- An open-ended option allows respondents to include brands you may not have known about.
- Which qualities do you believe describe [your brand?}
- Question Type: Multiple choice, multiple selection or open-ended
- Answers: Offer a variety of qualities and portrayals — this includes both positive and negative answer options.
- An open-ended option allows respondents to answer more accurately about what they associate with your brand.
Surpassing All Your Brand Awareness Goals
Whether you want to increase your brand awareness or simply measure it, you should regularly conduct brand awareness surveys. You can customize these surveys to your liking and include even more granular questions than those mentioned above.
The key is to use a strong online survey platform, as not all market research platforms offer the same capabilities and customer support.
Use a survey platform that allows you to easily target your survey audience, create your questionnaire and deploy it to the masses (or to specific people).
Luckily, Pollfish facilitates all three of these critical aspects in the survey creation and distribution process.
That’s because we offer two methods of survey distribution: deploying surveys across a large network of random internet users in their natural digital environments via our Random Device Engagement (RDE) method, as well as allowing you to target specific customers with the Distribution Link feature.
Additionally, Pollfish survey software allows you to create and analyze a thorough survey data collection, one you can customize as you see fit, view however you please and organize to the max.
In addition, with our vast array of question types, you can create virtually any type of online market research survey to support your research campaigns.
Researchers can leverage a wide range of information on their respondents by accessing a wide pool of insights in their survey results dashboard.
With this advanced market research platform, you can measure and increase your brand awareness with ease and at speed.
Why Surveys Are the Best Market Research Tool
Why Surveys Are the Best Market Research Tool

If you’re contemplating how to find the best market research tool, look no further than the survey.
This tool can be deployed to the masses instantly and uncover scores of critical information about your customers.
We’re of course discussing the online market research survey, rather than its non-digital counterparts available in offline market research.
That’s because online surveys offer a wealth of benefits that offline varieties, such as snail mail surveys, simply can’t match.
Surveys are a “nice to have” auxiliary. They reveal a wide breadth of insights about your customers and how they feel about your products and industry at large.
With this insight, you can improve your customer experience. 72% of customers will share a positive experience with 6 or more people, thus granting you free brand awareness and marketing.
Despite the critical insights businesses can access, only 25% of businesses last 15 years or more. Clearly, failing businesses are lacking customer insights and need survey research.
This article addresses why surveys are objectively the best market research tool in online market research and in their entirety.
Surveys Are the Best Market Research Tool: Campaigns They Support
One of the strongest abilities of conducting online research is that it can support a wide variety of business campaigns. This includes aspects of all areas of your business, as your customers affect it beyond the scope of marketing and selling.
While there are too many to list, here are some of the major campaigns and macro-applications this kind of research supports:
- Early business ventures
- Before you found and build any new business, you’ll need to know whether your idea is viable within your industry and niche.
- You will need to create a business plan as a framework for all your new business endeavors. Check out how to do market research for a business plan,
- Concept testing
- This practice is critical to conduct before you introduce new products to your industry.
- Engage in testing a variety of concepts to see which resonates the most with your target market, along with which has the highest demand.
- You can also use it to ask customers themselves to pitch concept ideas for products and services.
- Customer development
- This refers to the mid-portion of the lean startup model, which is designed to tackle the problems in product development.
- It requires to first fully evaluate a product opportunity and then ensure that the solution you propose will meet market demand and customer needs.
- Advertising research
- This is used to gain insights into the effectiveness of past and ongoing advertising campaigns, as well as to help brainstorm new ones.
- You can conduct A/B tests on ads, run surveys, view existing ads in a similar business and more.
- Brand tracking
- Gauge the performance of your brand-building efforts, such as brand reputation, awareness and perception against key metrics.
- The brand tracking survey is one of the simplest and most accurate sources for keeping track of your brand health.
- Consumer analysis
- Create a customer analysis, as understanding your customers is the core of market research.
- There are various online approaches to establish this, including secondary and primary sources, which you can use to build your analysis.
- Purchase frequency
- Use a specialized analysis, such as the RFM analysis, to learn about customer buying behavior, preferences and how frequently they buy.
- Conducting online research can also help you increase your purchase frequency.
- Customer satisfaction
- Satisfy your customers by understanding how they perceive your products, services and overall experience (CX).
- Surveys help you test your customer support and engagement sessions.
- Business relationships
- You can improve your business relationships by learning how your business customers, vendors and partners feel about working with you, and what they seek from the industry at large.
- You can do so via B2B surveys
- Learn how to lower bounce rate
- You’ll ideally want to lower your bounce rate and determine what your site visitors seek and don’t will help do so via survey research.
- This involves managing your site’s UX and user-friendliness.
- Conduct global studies
- The right platform will make it easy to conduct global market research.
- You’ll need to appeal to customers abroad and thus, go beyond the ability to serve them.
- Survey research will help you understand their cultures and norms to better market to them.
- Branding Initiatives
- Surveys allow you to understand how your customers feel about your branding initiatives, whether it is a new slogan, value proposition or overall image.
- You can even conduct logo testing with survey campaigns.
- Market segmentation
- Understand the makeup of your target market by segmenting its various groups via market segmentation.
- Learn about the existence of customer groups in depth, along with your customer personas.
- Product satisfaction
- You can determine how your customers perceive your products before or after a product goes to market.
- Surveys enable you to measure satisfaction through various question types.
Key Benefits that Make Surveys the Best Market Research Tool
Aside from allowing you to conduct research campaigns on a wide spectrum of business applications, topics and undertakings, surveys are the best market research tools because they offer a variety of other benefits.

The following explores some of the foremost benefits that surveys offer to researchers across industries.
1. Representing the views of many with one method
Surveys allow you to accumulate the responses of a large number of people in your target market, or survey target audience. In doing so, surveys enable you to get representative views of a wide swath of people.
Rather than having to find multiple ways to conduct primary research on your audience, surveys empower you to do so through just one means and one tool: the survey itself. What you can do with your survey, however, depends on your survey platform.
With surveys, you can obtain key statistics, as well as the representation of individual views and experiences. In this way, you can conduct both quantitative market research and qualitative market research.
That’s because you can create a multitude of multiple-choice questions, or ask a few in-depth one-ended questions to your respondents. You can even intermix both approaches into one survey.
At any rate, surveys are your one-stop shop for gaining insights into all your customers' perceptions, thoughts, needs and views.
2. Narrow respondent targeting
Surveys are multifaceted; they don’t just involve the questionnaire portion.
Targeting is another critical aspect of surveys, often the very first you’ll need to work with. You’ll need to set in specific respondent qualifications in order for your survey to target the correct people.
By doing so, those that don’t fit your respondents' qualifications will be disqualified, thus their surveys won’t be used in your target market sample.
A strong survey provider will include narrow targeting, meaning that you can target respondents on a much wider variety of categories than just age, gender and location.

Instead, your survey should allow you to target participants using the following categories:
- Ethnicity
- Household income
- Marital status
- Employment status
- Number of children
- Organization
- Mobile usage criteria
- Geolocation criteria
- Country, region, state, county, city, US census region, postal code, etc.
In addition, your survey should allow you to include screening questions, in which respondents will gain entry into your survey only if they answer the questions in a particular way or with a certain response.
3. Worldwide reach
Globalization and a connected global economy have made more companies shift their focus to markets abroad.
Thus, you should conduct research on your international customers. Conducting surveys makes this possible.
Your survey provider should make it easy to research customers from around the world without hassle. With Pollfish, you can conduct global market research, as the platform reaches respondents in over 160 countries.
In addition, Pollfish doesn’t charge you more for conducting surveys in different countries.
Our survey translations feature makes it easy to understand international data, as it will likely be in a language other than English. The feature allows you to translate all the languages supported by Google Translate.
It would be nearly impossible to conduct global research without the use of an online survey platform.
4. A variety of options to customize your questionnaire
Surveys allow you to be flexible in the type of survey studies you launch, and not in just the topic of the survey. Thus, you can customize your questionnaire by adding a variety of question types.
A strong platform will be able to support various types of survey questions. This includes the following:
- Single Selection
- Multiple Selection
- Matrix Question
- Drill down question
- Open-ended
- Slider
- Ranking
- Net Promoter Score (NPS)
- Rating stars
- Numeric open-ended
You can also customize your questionnaire by adding advanced skip logic. This creates question paths for different respondents based on how they answer certain questions. Logic routes respondents to relevant follow-up questions based on their previous answers.
In addition, you can make your questionnaire unique with a variety of survey templates for different campaigns. For example, Pollfish offers templates on brand awareness, advertising testing and many other topics.
5. The ability to study any topic or support any campaign
This can be done by adding the aforementioned survey templates, which set the questionnaire by way of a topic and its accompanying questions.
You can modify these templates to your liking, by either editing the questions, removing them, adding new ones and changing their order.
You can also study topics that are more unpleasant to discuss. Thus, these would be increasingly difficult to include in in-person and even phone interviews or in a focus group.
Surveys facilitate this type of campaign by providing full anonymity to respondents, as well as providing ease of adding sensitive questions. These include a variety of subjects that respondents would otherwise feel awkward or uncomfortable sharing their thoughts on.
6. Fast Responses and Data Collection
A strong survey platform will retrieve data quickly. Much faster than you would with any other market research method, since it is automated.
Pollfish surveys often take hours to fully complete, with a few days being the longest wait period.
 Real-time results makes it a kind of real-time market research, despite not observing customers as something occurs to them. However, you can still view their completed responses in real-time, so, when automated, survey research is a kind of real-time market research.
With speedy access to survey data collection, you will get results far sooner and can take action all the quicker to please your customers.
7. Candid Responses
This is made possible due to the organic survey sampling method, specifically, Random Device Engagement (RDE).
This survey distribution model, also commonly referred to as organic sampling, is a method that randomly distributes surveys across the internet, prompting random users online to take the surveys.
RDE engages random netizens where they are, voluntarily. They are therefore not professional survey panelists, but real customers that aren’t pressured to answer questions in a particular way.
Thus there is no need to be wary of the survey bias that arises from professional survey takers and panelists. Many of those individuals aren’t fully anonymized or have their identities hidden (from the researchers) at all. Thus, they are under more pressure to answer questions in a cartina manner.
You don’t have this problem in organic sampling, as non-professional survey takers exist where they are online on their own will, In addition, their identities are completely private. Thus, they are free to answer questions honestly.
Gaining all the Data You Need
At this point, you should see the extensive value that surveys bring for all your research needs.
However, despite all of this, a survey is only as strong or useful as the online survey platform that hosts it. As such, it is even more important to decide on the proper survey platform before you choose a survey type to run, let alone begin conducting a campaign.
You should therefore select your survey platform carefully. A strong provider will allow you to fulfill all of your online market research activities. This includes all the activities mentioned in this guide and more.
Pollfish survey software allows you to create a comprehensive survey data collection, one you can customize to your liking, view however you see fit and organize it to the max.
We offer an advanced method to deploy your survey to millions of random users online via the organic sampling method.
Ours is called Random Device Engagement (RDE), a kind of polling that relies on advertising networks and other digital portals on devices, to engage random people where they are, voluntarily.
This way, respondents won’t feel pressured to answer in a particular way, as survey panelists would, as they are completely anonymous and randomized.
Researchers can reap a wide breadth of information on their respondents and access a wide pool of insights in their survey results dashboard.
In addition, you can send your survey to specific respondents and on specific digital spaces, by simply using the Distribution link feature. This allows you to post your survey anywhere you wish, along with emailing it to those you wish to research.
When you rely on such an exhaustive online survey platform, you can carry out any survey campaign you wish and get timely results.

Attaining All Research Goals with Online Market Research
Attaining All Research Goals with Online Market Research

Online market research is the foremost method of modern market research, owing to its speed, accuracy of execution, ability to reach millions and plenty more.
You shouldn't, however, mistake this kind of research for one subtype (such as keyword research or internet database research). That’s because this kind of research is an umbrella term that encompasses many methods and approaches.
You may be wondering, is online market research relevant to your business?
Well, 81% of customers conduct online research before they make a purchase. Thus, if you aren’t already conducting this kind of research, your customers already are to judge your business.
Thus, you’d be remiss not to conduct it. You wouldn’t want to miss out on sales opportunities.
After all, 68% of companies increased sales with market research. And online market research is the dominant form, for a variety of reasons.
This article expounds on online market research, its various types and its importance, along with how and which campaigns you can apply it to.
Understanding Online Market Research
As its name implies, this is a form of research conducted entirely online, utilizing a variety of means to gather critical customer insights.
As such, it is the direct opposite of offline market research, which is predicated on using various non-digital, and non-internet-related sources to conduct research on customers.
The reason that online market research is used specifically to collect customer insights is that it is a form of market research, which involves all the activities used to study your target market — the group of customers most likely to buy from you.
As such, market research is a kind of research driven by the study of the following topics, as they relate to your customers and industry:
- Customer preferences
- Customer behavior
- Needs
- Desires
- Aversions
- The customer buying journey
- Demographics
- Psychographics
- Lifestyles
- Sentiments and attitudes, especially in relation to your business.
Online market research involves using a variety of methods to facilitate research campaigns. Because of this, it is not bent on using just one method. Instead, it involves all the activities and tools available to study your customers and the industry at large.
You can use several forms (or subtypes) of this research, or you can use this research to accompany other forms, such as real-time market research and offline market research. But you don’t necessarily have to.
That’s because this kind of research includes many different kinds of methods and tools, allowing you to reap all the customer intelligence you need.
The Types of Online Market Research
Given that this research is largely an umbrella term for a range of online activities for researching your customers, you ought to know what kinds it includes.
As the market research industry evolves, the following list will change, as some methods will die out and more will be added. This is because this kind of research is reliant on technology, specifically, the internet, which is constantly progressing.

The following lists the names of various forms of this kind of research:
- Internet research
- A secondary research method that typically involves searches on search engines.
- Keyword research
- This is especially used for understanding the demand of products and services.
- Market research software
- These are platforms designed to automate the research process and are typically used in agile research.
- DIY market research
- This is a kind of research that businesses and researchers can conduct on their own through a variety of tools.
- Syndicated research
- This is virtually the opposite of DIY research, as researchers use a research firm to conduct the entirety of their research campaigns. In this context, they do so digitally.
- Real-time results research
- Closely tied with real-time research (a kind of ethnographic research), it involves using a platform that offers customer data in real-time.
- This is its own category, as not all market research software offers this.
- Competitor research
- This involves paying close attention to your competitors’ digital properties to observe how they carry out their offerings and how their customers engage with it.
- Survey panels
- Much like syndicated research, this too is external, as a company amasses a research panel to partake in research campaigns.
The Importance of Online Market Research
If the above sections, which delve into the many capabilities of online market research didn’t convince you of its importance, the following will.
First and foremost, this kind of research allows you to understand your customers in great depth, the kind you wouldn’t have access to in other forms of research. That’s because it’s far easier to reach people online, rather than via mailed surveys or interviews.
Secondly, it enables you to understand how viable a product is in your industry before you launch it, to avoid low sales. In addition, it can help you innovate and improve upon already existing products.
That’s because there are various ways to conduct product research, such as via general internet research. Or, you can do this through a market research tool that you would only get from a market research platform. For example, the Van Westendorp Price Sensitivity Meter is a pricing model that provides data for consumer price preferences.
You can also use this kind of research to improve your entire customer experience, from the first impressions of your business, to browsing your digital properties to finally making a purchase and beyond.
With a good CX, you’ll be able to delight your customers across all touchpoints, building a strong relationship with them, in turn. This itself has a wide variety of benefits for your business.
A good relationship with your customers fosters consumer loyalty, which you’ll need in order for customers to come back to your business time and again. You wouldn’t want to have a “one and done” customer.
Thus, by conducting this research and pleasing your customers, you’ll be able to increase your customer retention rate. Retention is paramount, as it is both more profitable and attainable.
For example, increasing customer retention by just 5% can increase profits from 25-95%. In addition, acquiring a new customer costs five times more than retaining an existing one.
Thus, it’s crucial to maintain adequate customer retention. By running online market research, you can also maintain or even increase your customer lifetime value, the quality of your customers in relation to the length of their patronage of your business.
This metric also ties in with retention and is a must to keep your business competitive.
What Campaigns and Macro-applications Online Market Research Can Support
One of the strongest abilities of conducting online research is that it can support a wide variety of business campaigns. This includes aspects of all areas of your business, as your customers affect it beyond the scope of marketing and selling.
While there are too many to list, here are some of the major campaigns and macro-applications this kind of research supports:
- Concept testing
- This is ideal to do before you introduce any new products into the market.
- You can test a variety of concepts to see which resonates the most and which has the highest demand.
- This is also used to ask customers themselves to pitch concept ideas for products and services.

- Customer development
- Conceived by an entrepreneur, this is the mid-portion of the lean startup model, which is designed to tackle the problems in product development.
- It requires first fully evaluating the product opportunity and then proving that the solution proposed will meet market demand and customer needs.
- Writing a business plan
- Before you embark on any new business, you’ll need to know whether your idea would be viable.
- Thus, you will need to create a business plan as a framework for all your new business undertakings. Learn how to do market research for a business plan,
- Advertising research
- There are a variety of ways to use this form of research to test ad campaigns.
- You can conduct A/B tests of ads, run surveys, view existing ads in a similar business and more.
- Brand tracking
- These campaigns involve measuring all your brand-building efforts, such as brand reputation, awareness and perception against key metrics.
- There are various methods to keep track of your brand health, but using the brand tracking survey is one of the simplest and most accurate sources of this campaign.
- Consumer analysis
- Analyzing your customers is the core of market research.
- There are various online approaches to conducting this research, including secondary and primary sources, which you can use to build your analysis.
- Purchase frequency
- Create specialized analyses, such as the RFM analysis to learn about customer buying patterns and behaviors.
- Conducting online research can also help you increase your purchase frequency.
- Customer satisfaction
- Satisfying your customers involves using a variety of avenues to get them hooked on your products/services, engaged in your social and other posts and keeping your business top of mind.
- Use research to test your customer support and engagement sessions.
- Business relationships
- Learn more about how your business customers, vendors and partners feel about working with you, or what they seek from the industry at large.
- You can do so via B2B surveys
- Learning how to lower bounce rate
- One of the many metrics you’ll contend with on your site, your bounce rate is one you’ll ideally want to lower.
- This involves testing your site’s UX and user-friendliness.
- Conducting global studies
- You’ll need to appeal to global customers beyond the ability to serve them. Conducting research will help you understand their cultures and norms to better market to them.
- The right platform will make it easy to conduct global market research.
Forming Strong Business Campaigns
Online market research guides and supports a vast variety of business matters. As such, you should never forgo conducting this research, as it reveals much about your customers and industry, and most importantly, informs you on the actions you need to take.
You should therefore select your market research platform carefully. A strong market research company will allow you to fulfill all of your online market research activities.
We suggest using a survey platform that offers a wide range of capabilities and functionalities. This will ensure valuable campaigns that are rich in insights, that also provide you with ease of survey deployment and analysis.
Pollfish survey software allows you to create a thorough survey data collection, one you can customize to your liking, view however you choose and organize it to the max.
In addition, with our vast array of question types, you can create any type of online market research survey to support your research campaigns.
Researchers can leverage a wide pool of information on their respondents by accessing the data in their survey results dashboard.
When you have the support of such a platform, you can tackle all your research needs.

The Guide to Using Crosstabs in Pollfish (Late 2022 UPDATE)
The Guide to Using Crosstabs in Pollfish (Late 2022 UPDATE)

Summarize this article with AI:


Crosstabs are a matrix-style format for data visualization and are one of the most useful and common ways that market researchers analyze data. Pollfish offers cross tabs as an excel export for easy synthesis outside of the platform.
Analyze Pollfish data using crosstabs
Crosstabs are an easy way for researchers to synthesize data and analyze the relationships between two (or more) variables. The variables represent categorical data from the survey, and are displayed in rows and columns in a matrix for researchers to quickly find data in corresponding cells.
Many traditional tools and services offer crosstab reports, although the process is extremely manual. Researchers may only have access to the raw data from their studies initially and need to request that a crosstab report be generated for them. Because these reports are often an additional service, this can add significant expense to a research project.
Pollfish has always been at the forefront of market research technology, so we tackle crosstabs a bit differently. Our process is automated to generate crosstab reports from the survey data that we collect, which is a better fit for convenience, cost, and accuracy for teams of all sizes.
As of May 2021, Pollfish has launched a new edition of crosstabs known as Volume 2 and there will be another iteration coming soon.
Get started with crosstabs in Pollfish
To take advantage of the crosstabs feature in Pollfish, visit the results page of a completed survey, select “Export results” and choose “Crosstab” as your export option. You will be sent an email that notifies you when your export is complete. Open the document in Excel or Google Sheets to get started.

The crosstab sheet will include four “tabs” across the bottom.
- Count: This sheet shows the number of responses that fit a row and column.
- Percentage: This sheet shows the percentage of all responses from the survey that fit a row and column.
- Row Percentage: This sheet shows the percentage of the row that falls into a specific column.
- Column Percentage: This sheet shows the percentage of the column that falls into a specific row.
Example results using Pollfish crosstabs
Say you’re interested in Android users, specifically those who might switch to using an iPhone. You could run a survey, similar to the one below to ask men and women of all ages their opinions about the two devices.

However, you could achieve a deeper level of insight by exporting these results to crosstabs, and seeing what data correlations come from it. For example, how many women are considering switching to the iPhone?
Using the “Count” tab, you can see that 39 women from the survey said that they were considering switching to an iPhone. Using the “Percentage” tab, you can see that the 39 women represent 13% of the sample population that was surveyed.


The “Row-Percentage” and “Column-Percentage” tabs are inverse tables of data that show the percentage of the rows that belong to a single column, and vice-versa. You can toggle between these tabs to choose the view you prefer.
In our example, we can see that 52% of the respondents who were considering switching to an iPhone were women, where the rows and columns are displayed differently depending on the tab selected.

To gain familiarity with crosstabs, you can view the iPhone survey here and check out the crosstab export to see how the data looks. Or, you can export your own finished Pollfish survey to explore your results with a new tool.
Understanding the Updated Crosstab Features
In the Pollfish Crosstabs export file, all questions can appear in both the columns and the rows. In the Crosstab Designer, specifically, researchers can drag and drop to add whatever they see fit for their analysis. The answers can be based on different demographics, along with the percentage of those demographics that have answered in a particular way.
In our advanced version, the cells include more than just percentages of responses. Rather, the data is featured in boxes, with each box containing various information. This includes the count and percentage. In addition, the new Crosstabs version includes more columns per question, with each column representing a different answer.
The data on each answer is then displayed in each box. This version gives researchers a far more organized and granular view of their survey results.
What’s best is that researchers can generate these on their own. Moreover, they can easily drag and drop the questions into the report themselves, so that the report features only the relevant data.
The Two Types of Crosstab Solutions
The Pollfish online survey platform offers two types of crosstab solutions. Each offers a different way to layout your resulting data. The second type has been updated and has several new features to power your survey analysis needs.
- The first solution includes the results from the results page. It can appear as:
- All data or Current view
- It bridges the gap between the excel individuals file and the results page.
- The second solution is called Crosstab Designer.
- This is available for clients with an Elite plan.
- This type of crosstab has new upgrades.
- The Crosstab Designer 2.0 allows researchers to preview their crosstabs and instantly download their crosstabs.
- This allows researchers to design, preview, and download their custom tabular results view.
- It also allows researchers to choose what to crosstab without any limitations. Therefore, it is entirely custom.
- Afterward, they can preview it and download it instantly in seconds on any device
- The new Crosstab Designer supports:
- Crosstab Previews
- Instant downloads
- This will soon support A/B tests.
These first two Crosstab solutions offer translations and both of them also can generate .XLS files.
Crosstab Support for A/B Tests (Monadic and Sequential)
Crosstabs have been updated to include questions and answers per concept.
Specifically, if your survey included an A/B test with three concepts and one single selection question, you will get a crosstab with the question repeated three times. This makes it the same amount as the concepts, with both the columns and the rows.
This change is applicable to both types of A/B tests. These are the:
You can filter the responses by concepts, demographics, along with answers and use the current view export, which will generate a Crosstab based on the filtered responses.


Our team is excited to help you learn more about this newly updated feature, so don't hesitate to reach out to our 24/7 Customer Experience team if you need assistance.
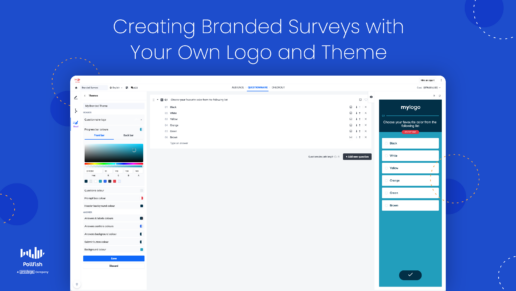
Creating a Branded Survey with a Customizable Logo and Theme
Creating a Branded Survey with a Customizable Logo and Theme

A branded survey is a unique way to present your business to your respondents by featuring the likeness of your brand.
It enables you to create a custom survey experience, which is not merely critical for branding market research, but for all your branding efforts.
In the ultra-competitive landscape of brands today, many of which are jockeying for your attention on the internet, brand awareness is essential. In fact, 45% of marketers rank increasing brand awareness as a top priority for their business.
As such, branding your surveys is a less conventional, albeit innovative way to increase and maintain brand awareness among your target market.
This article delves into the branded survey, its importance, examples and how to create one with a customizable logo you can place in your questionnaire and elsewhere.
Understanding the Branded Survey
A branded survey is a survey that outwardly features your brand, whether in name, logo, related image or another type of likeness.
Such a survey directly points out that the survey is not used for an anonymous source or company. Rather, it is the product of a specific brand that asks internet users to partake in it.
You can create a branded survey on Pollfish by adding your logo to your survey’s questionnaire and customizing its header, text and more.
This kind of survey is one of the many market research techniques, as it can be used to collect key consumer insights for virtually any campaign, whether it’s for advertising, customer segmentation, brand reputation or any other market research purpose.
However, unlike its non-branded counterparts, this kind of survey is unique in that it features your brand front and center. Thus, the respondents will never have to wonder which company or entity they are taking the survey for.
You can brand your survey in the following ways:
- Adding your brand to the title of the survey
- Placing your brand name in the introduction of the survey
- Putting your brand name in one of the survey questions
- Inserting your brand in the thank you or closing page of the survey
- Adding your logo to the survey (as opposed to the Pollfish logo or having no logo at all)
Why Branded Surveys are Important
When you brand your surveys, first and foremost, you are giving your brand a competitive edge.
That’s because they can provide yet another placement for branded content on the web.
Branded content is incredibly important, as it is more effective than pre-roll ads, which are the promotional videos customers see before their chosen content. 86% of viewers could recall a brand after viewing branded content than regular pre-roll ads.
Luckily, these surveys aren’t ads, they’re surveys that exist on a massive network on website and app publishers.
Thus, a branded survey is another means to keep your brand top of mind for your customers.
This means, in a branded survey, your survey won’t merely be used for typical market research purposes. It will also provide you with brand awareness as it’ll make your customers recall your brand, while those who haven’t heard of you will be prompted to learn.

Branded surveys also enable you to engage in white-label market research. As such, when people come across your survey online, it’ll be recognized as yours only. That’s because there are no indicators of a third party, i.e., a market research survey platform.
Thus, your survey will appear as proprietary to your brand, thus giving you the full white-label experience.
For those who support your brand, seeing your logo in your survey will capture their attention better than a survey without a logo or likeness to your brand. As a matter of fact, a branded survey encourages your online customers to check out the survey and most importantly, complete it.
Thus, a branded survey hooks your target customers’ attention better and leads to a higher survey completion rate, allowing you to get timely results and complete your market research campaign.
If you are hesitant about revealing your brand in your survey, you may want to consider another crucial reason to do so. This involves collecting feedback after a sale to learn about the entire customer buying journey, along with the customer experience whilst making a purchase.
This involves getting insights into your customers’ e-commerce experience, and post-sales support, along with getting feedback from your own employees. As such, this feature is great to pair with the customer experience survey.
All in all, branding your surveys provides an excellent opportunity for the following:
- Creating branded content
- Fostering brand awareness
- Producing brand recall
- Capturing attention
- Forging interest in your survey
- Promoting your values and mission
- Standing apart from your competitors who don’t use branded surveys
- Understanding your CX during their purchase and post-sales
Get started on yours!
Create a Branded Survey on Pollfish
Creating a white-label branded survey on Pollfish is easy. This is made possible by the examples in the numbered list in the Understanding section. However, what’s special about branding in a Pollfish survey is that you can add a logo to your questionnaire.
Let’s learn how to do this. Like many other features on the Pollfish online survey platform, it’s easy to add a customizable brand logo. In Pollfish, this would live in the Questionnaire portion of the survey.
-
- Create a new project and choose the deployment method. There are two options: random device engagement (RDE) or sending your survey through your own chosen platforms and specific people.
- Go to the Questionnaire section.
- On the left-hand panel, go to the bottom and select Themes.
- Select the New Theme button.
- You can also select Default survey style and click on Duplicate. (This will create a Default survey style copy field to appear above the Default survey style field).
- Next, customize your theme.
- Themes are available to apply to your surveys. There is no need to recreate them from scratch.
- All themes are available to all team members.
- You’ll have various options that pop up. These include options to customize the following:
- Title of theme
- Header Options:
- Questionnaire logo (add your brand logo)
- Progress bar colors
- Questions’ colors
- Prompt box color
- Header background color
- Answer Options:
- Answers and labels text color
- Answers control color
- Answers background color
- Submit button color
- Background color
- Once done, hit Save.
- This will save the particular branded survey.
- Return to the Themes left-hand panel.
- Here you can edit, duplicate or delete the surveys by clicking on the triple dots next to each one.
- Add questions to the Questionnaire and voila! — you’ve got yourself a branded survey.
Examples of a Branded Survey on Pollfish
Now that you know how to create this kind of survey on the Pollfish market research platform, let’s take a gander at what it actually looks like.
The following provides examples of branded surveys on our platform:

Use an advanced editing solution:

Branding Yourself in Market Research Campaigns
Creating a branded survey is a unique and effective way to not only conduct market research, but to engage in a branding technique.
As such, this kind of survey goes beyond the primary purpose of a market research survey. It serves as a tool for creating brand awareness and other key needs for your branding efforts.
You can therefore use it to not simply ask questions, but embed the key things you’re proud of about your brand in the questions.
To do so efficiently, you’ll need a strong online survey platform to host it. This means it is even more important to decide on the proper survey platform before you begin on branded survey creation.
A potent survey provider will allow you to fulfill all of your online market research activities at speed and with ease.
Pollfish survey software allows you to create a comprehensive survey data collection, one you can customize to your liking, view however you see fit and organize to the max.
We offer an advanced method to deploy your survey to millions of random users online via the organic sampling method RDE method.
Additionally, researchers can reap a wide breadth of information on their respondents and access a wide pool of insights in their survey results dashboard.
With such a powerful online survey platform, your branded surveys will always be easy to create and deploy. Thus, you’re in good hands.

How to Create a Survey with Sensitive Questions and Avoid Being Flagged on Pollfish
How to Create a Survey with Sensitive Questions and Avoid Being Flagged on Pollfish

Setting up a survey that deals with sensitive topics is never an easy feat for any party involved. To avoid trouble in your market research endeavors, we’ve updated our Review Policy for sensitive questions/topics. (See the Pollfish Review Policy section in this article)
Although the Pollfish platform offers a vast pool of question types and makes it easy to incorporate any question type, getting respondents to complete surveys with sensitive questions is not guaranteed.
Our review team may flag your survey and even block it from being launched if we deem it inappropriate.
In fact, if you ask sensitive questions in a reckless manner, it is bound to turn respondents away from completing the survey, or beginning one in the first place. Thus, these kinds of questions mar the survey experience for respondents and can lead to survey attrition.
But that does not mean you ought to omit surveys and their larger campaigns due to the inconvenience of the questions being sensitive in nature.
You can still create effective surveys by asking the sensitive yet necessary questions as long as you do so with certain best practices to make it a better experience for your respondents. This article explains how.
What are Sensitive Questions?
The notion of a sensitive question is not as subjective as it may appear. These questions make respondents feel embarrassed or uneasy due to the nature of the question, its tone, context or setup.
Here are some of the question types that can cause respondents to feel uncomfortable:
- Questions that invade privacy:
-
-
- Religion, political stance, sexual behaviors
-
- Questions that ask about illegal behaviors:
-
-
- Drug use, theft, perjury, other illegal acts
-
- Questions that pose a risk or paint the respondent in an unfavorable light:
-
-
- Cheating on partners, tests, taxes, thoughts on their colleagues or job
-
- Questions on identification (especially if detailed):
-
-
- Income, age, race, job title
-
- Questions with socially desirable responses:
-
-
- Voting history, exercising, wearing a seatbelt)
-
- Questions that deal with unpopular ideas:
-
-
- Racism, ageism, etc.
-
While you cannot change the nature of a question, you can still set it up so that it is poised to be better received — and answered.
Other Factors Causing a Distressful Survey Experience
Aside from the questions themselves, there are other factors in your survey relating to the questions that can render an uncomfortable survey experience. As such, you should be aware of these to understand the respondents’ perspective.
Additionally, understanding them will help you avoid running into these pitfalls and optimizing your surveys for effective survey campaigns. The following discusses the major causes of distress and survey attrition in regards to sensitive questions.
- The privacy (or lack thereof): Privacy is of the utmost importance when it comes to filling out any survey. When it comes to surveys that deal with sensitive topics, it is especially important, as no responder will want to associate their identity with their answers.
- Although your survey is private, perception is key, as respondents may perceive that their participation may still be traced back to them
- The mode of the survey: This involves the means of administering the survey; some may send it via email, while others rely on a survey platform.
- This is an issue of presentation, which may influence respondents’ perception of privacy.
- Ex: Emails sent to respondents remove the air of confidentiality, since it was sent to a particular address, which often is the respondents’ names.
- This is an issue of presentation, which may influence respondents’ perception of privacy.
- Brand Reputation: When dealing with sensitive topics, respondents are particularly aware of the organization to which they will provide answers on sensitive topics.
- Some surveys do not mention the brand or organization which they represent, while others may.
- In relation to sensitive questions, respondents may feel unnerved to share answers with certain companies.
How Sensitive Questions Harm Your Survey When Used Incorrectly
As mentioned in the introduction, using sensitive survey questions without heeding critical best practices have grave consequences for your survey campaign. They tarnish the accuracy of the responses, an issue no survey platform can fully evade.
They also lead to respondents unwilling to take your survey, that is, they won’t even open it to give it a chance. This makes fulfilling your survey quotas and number of completes a more difficult and lengthy process.
Survey attrition is another issue spawned when sensitive questions are used improperly. Market researchers can avoid poor quality data and survey attrition by setting up surveys with sensitive questions in a thoughtful manner, one that fully takes best practices into consideration.

How to Ask Sensitive Questions the Correct Way
Market researchers can still extract responses on sensitive subjects by doing so with best practices.
As such, you need to devise your survey strategically so that you don’t repel much-needed respondents. In order to keep responders in the survey, having them answer honestly and answering all the questions, apply the following methods.
These methods will avoid summoning feelings of distrust and general unease. They will also help you build your survey in a way that is conducive to a good user experience.
-
- Be upfront about privacy: Relay a confidentiality guarantee.
- Either in the survey callout, invitation or introduction, assure your respondents that their participation is completely confidential.
- Let them know the precautionary methods you’re taking to ensure their answers remain hidden from general view and are not associated with their names.
- Be transparent with the purpose of the survey. Tell the respondents upfront what the topic of study is along with its purpose.
- Doing so will avoid surprises and when respondents know what they’ll be dealing with upfront, they’ll be less disinclined to complete their surveys.
- Be honest with anonymity. Don’t relay that a survey is anonymous unless it actually is.
- On the Pollfish platform, all responses are anonymous based on our terms, so you can state that the survey is anonymous.
- Additionally, the survey must contain one initial screening question that states the study’s content and asks for respondents' age and consent. For example:
- “The following survey contains questions regarding [sensitive content input]. Are you willing to take part in the following survey? 1. Yes, I am 18 years old and above and I give my consent 2. No’'
- Build up to sensitive questions, don’t ask them right away.
- Don’t ever present sensitive questions first; instead, lead up to them by asking more neural questions that become more specific with each incoming question.
- This way, you can avoid shocking your respondents and turning them away from answering or providing honest questions.
- Use ranges instead of specific values.
- Respondents may not feel comfortable with revealing the exact amount, especially if it deals with a negative behavior or societal disapproval.
- For example: instead of providing precise numbers as answers to, “how many times have you fought with your spouse?” or “how many times have you smoked cigarettes last week?” use ranges, such as “under 3 times last week,” “3-5 times,” etc.
- Use “question loading” to elicit honest answers.
- Not to be confused with loaded questions, question loading involves blanketing a question with context, so as to make the subject in question appear more normal and acceptable.
- This will make respondents feel less guilty of partaking in a certain behavior, act or inertia.
- Ex: Instead of asking “did you exercise last week?” question load the question to normalize the less acceptable answer (of not exercising).
- Question-Loaded: “Given that the average American worker works 9 hours a day and has several responsibilities, exercising is not always a priority. With that in mind, how many hours of exercise did you do last week?”
- Use frequency questions instead of yes or no questions, if the topic deals with partaking in a bad behavior.
- Instead of asking “have you ever run a red light when driving?” ask “how many times have you run a red light when driving?”
- The latter assumes the respondent has already done so, so their response cannot be a lie.
- If you used a yes or no question, on the other hand, the respondent would be less inclined to answer honestly, given that negative behaviors are not socially acceptable.
- Instead of asking “have you ever run a red light when driving?” ask “how many times have you run a red light when driving?”
- Provide an “I prefer not to answer” option.
- Try as one might to frame a question tactfully, sometimes respondents simply do not want to answer a sensitive question.
- Instead of losing a respondent due to one such a question, provide a multiple-choice option of opting out.
- This is best suited for surveys that include questions other than sensitive ones. If your survey applies questions on sensitive topics only, you should not include this option — unless it’s on one or two particularly sensitive questions.
- Be upfront about privacy: Relay a confidentiality guarantee.
The Pollfish Review Policy for Sensitive Questions
Starting in December 2022, Pollfish is introducing a more stringent review policy for all surveys dealing with sensitive topics.
We don’t take sensitive topics lightly, especially surveys that cross the line and become inappropriate. This includes surveys that feature the following content:
- Rude language (swearing, insults, crude topics)
- Leading questions (those that contain answers that lead to certain opinions that respondents don’t necessarily hold but have no choice but to select)
- Offensive content or language
- Disturbing content (language, imagery or audio files)
- Insinuations
- Hate speech
This means, if your survey is deemed inappropriate, it will not only be flagged, but will have the possibility of being shut down completely.
Essentially, you won’t be able to run said inappropriate survey.
That’s why we ask you to please be aware of the content of your survey. Pay attention to all of the elements of your survey, such as:
- The overall theme and topic
- The subtopics
- The demographics
- The period of time (proximity to a scandal or controversial event)
- The language and tone
- The narrative the questions (and their answers) form
- The images and other multimedia files you include
- How you address certain sensitive issues (disability, illness, sexuality, race, religion, gender, gender identity, etc., political leanings)
- The positioning of the questions (some will need advanced skip logic so that only the most relevant respondents will be routed to a particular question).
- The quotas you set on the demographics and psychographics of your survey audience
Now, let’s get into more basics of our policy. The original policy is composed of three criteria and they are as follows:
- Respondents must be at least 18 years old to take the survey. You can review your age targeting in the Audience tab.
- The survey must contain one initial Screening Question that states the study’s content, for example: “The following survey contains questions regarding [sensitive content input]. Are you willing to take part in the following survey?”
- Your responses are anonymous.
- There must be one question that explains the survey content briefly, along with the purpose of using such information and how you’ll use it.
The Pollfish team needs time to review your survey before pushing it live. If your survey is deemed inappropriate, it’ll be flagged as such in our survey process of approvals. We’ll ask you to edit it by either rephrasing your questions or removing them altogether.
Remember to be respectful in your surveys as you would be in real life. There is no need to shock or offend, or ask leading questions to push a narrative. Doing so will only tarnish the validity of your survey.
Extracting the Best Respondent Data
Obtaining quality data relies on several things, such as the questions themselves, the setup of the survey, how it’s introduced and the digital platforms it is deployed in. Additionally, it relies on the aid of a quality check function.
Thus, it’s important to invest in an online survey platform that facilitates the entire survey process — from creation, to deployment, to survey quality checks and post-completion quality checks. The Pollfish platform performs such checks with an AI-powered system. It voids incomplete surveys, those with gibberish answers, users of VPNs and more.
Ensuring the use of a competent online survey tool will maximize the success of your survey, allowing you to avoid the survey bias present in surveys with sensitive questions.
The Most Instrumental Pricing Questions for Market Research
The Most Instrumental Pricing Questions for Market Research

You’ll need to use a handy set of pricing questions for market research, specifically for your pricing research campaigns.
These questions are particularly useful in survey studies, as surveys — especially the online variety — are the most effective tools for conducting market research.
Online surveys grant you quick access to the customer behaviors and perceptions of your target market, the segment of customers most likely to buy from you.
As such, you should apply surveys to pricing studies, as the prices of your products and services are highly important to many customers. In fact, a wide swath of customers makes their purchasing decisions solely based on price.
That’s why you’ll need a solid set of pricing questions that you can use in your pricing survey and various other market research campaigns.
This guide lays out a variety of different types of useful pricing questions for market research to use in your pricing survey, including their key examples and importance.
The Importance of Pricing Questions for Market Research
Using pricing questions for market research is exceptionally important in the age of mass information and price-conscious customers.
Presently, a wide swath of customers makes their purchasing decisions solely based on price.
This is the case across virtually all industries.
A whopping 65% of customers check for price comparisons while they're physically shopping in a store. These comparisons then dictate their buying decisions, given that these price-conscious customers consider the price of a product as a key buying factor.
This is proven, as 57% of consumers consider price to be a top factor in deciding which company to buy from. Clearly, customers are paying attention to the price of your products — and you should too.
You’ll therefore need to have a reliable set of pricing questions in order to run a pricing survey or conduct any sort of pricing research.
It’s always helpful to have a guiding light for your research endeavors, so use this article to find useful pricing questions.
Types of Pricing Questions for Market Research
There are different types of pricing surveys; thus, you’ll find different kinds of pricing questions. Pricing questions can differ in the following ways:
- Differing formats
- Accompanying visualizations
- Question topics
- Question styles (yes or no, more contextual questions, etc.)
In order to conduct a strong pricing research campaign, it’s important to be able to identify the kinds of pricing questions out there, so that you not only understand them better, but can create them on your own and know which to use in different circumstances.

The following lists the four main types of pricing questions you’ll find in different market research campaigns. Some of them may require using a market research tool that supports a particular format and presentation, such as with a conjoint analysis and the Van Westendorp Pricing Meter.
Thus, the types of pricing questions you can create depend on the online survey platform you use. Not all survey platforms offer the same features, so you may not be able to use all of these question types if your online market research platform doesn’t support them.
Here are the four main types of pricing questions for market research:
- Van Westendorp Pricing Meter questions
- Customer Willingness to Pay questions
- Gabor Granger questions
- Conjoint Analysis
Now, let’s explore each question type by understanding it in greater depth and seeing some question examples.
Van Westendorp Pricing Meter Questions
These questions are used with a market research feature called the Van Westendorp Price Sensitivity Meter. This is a pricing model that provides data for decision-making in regard to consumer price preferences.
The meter uses a visualization in the form of a graph, with ratings on price and value. These are presented as responses to survey questions that focus on the prices of different products and services.
As such, it is used to determine customers’ willingness to pay a range of prices. It uses their answers to conclude the prices that your customers deem acceptable, too high, too low and optimal.

As such, this pricing model/feature usually comprises only four questions. They include the following:
- What price would be so low that you start to question this product's quality?
- Determines: Too cheap
- Alternate question: At what price would you consider the product to be so low that you would feel the quality couldn't be that good?
- At what price do you think this product is starting to be a bargain?
- Determines: Cheap/ good value
- Alternate question: At what price would you consider the product to be a bargain, aka a great buy for the money?
- At what price does this product begin to seem expensive?
- Determines: Expensive high side
- Alternate question: At what price would you consider the product starting to get expensive, not so much that it is out of the question, but you would have to give some thought to buying it?
- At what price is this product too expensive?
- Determines: Too Expensive
- Alternate question: At what price would you consider the product to be so expensive that you would not consider buying it
Customer Willingness to Pay Questions
This question category is simpler than the previous; it is also more specific, as it simply asks customers to share the actual price that they would pay for a product or service.
Customer Willingness to Pay Question Examples
This survey question can be asked in two ways:
- As an open-ended question, allowing respondents to write in their maximum pay number of choice.
- It may also present respondents with a range of numbers to choose from via a multiple-choice question.
- This can be either a single selection question, in which responders choose one price or a multiple selection question, where people can select more than one.
Direct and simple, Customer Willingness to Pay questions are therefore easy for researchers to create and for their respondents to answer.
Given that these questions only require participants to state how much they are willing to pay for something, respondents aren’t required to have any background knowledge about a product, nor do they need to have experience using it, or information about its industry.
Although respondents that do possess this background knowledge may have more realistic answers, it isn’t critical.
Although these question types are useful, they lack context. When there is no other information, and you ask about the willingness to pay at one point in time, this question risks getting inaccurate data due to the simple execution of answering.
In addition, respondents may overestimate their own price sensitivity, as they choose their own answers of the prices they themselves desire. These are understandably going to be lower than the actual prices of goods, which they would still buy.
Gabor Granger Questions
These questions use a market research feature called the Gabor Granger Model. This kind of survey feature works by establishing the maximum amount responders are willing to pay for a product or service.
The questions and answers are linked and presented in a flow chart-esque way, where the respondents are shown set price points to determine the highest one they would accept. Then, their responses are used to find the optimal price range for your target customer.
These pricing questions use advanced skip logic to continually move through a set of questions until the highest price point is reached.
Aside from determining the optimum price for your customers, the Gabor Granger model generates a price elasticity curve. This visualization illustrates the effects of raising and lowering the prices demanded, showing you just how the impact of pricing changes has on potential sales.
How it works:
- The initial price is $100; the respondent marks “No.”
- Then, $70 is shown; the respondent marks “Yes.”
- Then, $80 is shown: the respondent marks “No”
- Then, $75 is shown: the respondent marks “No.” -At this point, the question is complete, as $75 is found to be the highest price point.
This model is especially ideal in the following two scenarios:
- You already have a price range, but would like to sharpen it for accuracy
- You seek to learn the price sensitivity of your product in your industry.
Gabor Granger Question Examples
Here are some Gabor Granger question examples:
- If we changed our streaming service to include unlimited movies, how would you evaluate the following price points:
- Pricing Option: $50 per month
- Answers: Yes, No
- If we offer certain upgrades for a new rent increase, how would you evaluate the following rent raise price:
- Pricing Option: $100 more per month
- Answers: Yes, No
- What is the probability that you would buy this product at $400?
- Pricing Option: $400 (initial)
- Answers: Rating scale of 1-7, (1= not likely, 7 = highly likely)
- If we offered this product in a bundle, how would you evaluate the following price points:
- Pricing Option: $45
- Answers: Yes, No
Conjoint Analysis Questions
A conjoint analysis is another specialized market research feature. It allows researchers to measure the value that consumers place on various aspects of a product or service.
As such, it is used when you have other variables aside from price to evaluate, such as when you decide which features to include in a product, or which services to include in an offer to customers.
A conjoint analysis presents respondents with a series of configurations, with different price points, and asks them to choose their desired prices. These arrangements can be randomized as well, allowing you to see the trade-offs customers are willing to make.
Thus, it shows how your customers perceive the makeup of your offerings, in relation to the price.
This method breaks a product or service down by its various components, called attributes and levels. Researchers can test different combinations of the components to identify consumer preferences.
Although this is one of the most complex pricing models, it is also the most accurate. A strong online survey platform, however, will make it easy to run this model, as it can be used as another survey question.

The Two Types of Conjoint Analysis Features on Pollfish
- Choice-Based/Discrete-Choice Conjoint Analysis:
- Users are asked to choose repeatedly from a set of 3-5 full profile concepts. It’s designed to mimic real-world shopping behavior by presenting two complete offerings side by side. The data is then analyzed to identify the preference for different attributes and features based on the trade-offs the user made when making their choices.
- Maxdiff Conjoint Analysis:
- Also called the Best-Worst Scale, a Maxdiff Analysis is a mechanism for prioritizing new product ideas and tailoring them to consumer preferences.
- This is a kind of conjoint analysis that helps brands determine the value that their customers place on different parts and features of a product.
- Respondents choose the best and the worst option from a given set of options, which relate to a product and its feature(s).
- Respondents rate a list of items by selecting only two of them — the complete opposite of each other, labeling one as the best of the list and one as the worst.
- This technique helps to identify what your target market values and what it despises.
- Users are shown a series of packages and asked to choose the best/most preferred and worst/least preferred. It’s designed to cut out the ‘middle ground’ and focus respondents on the best and worst items in a list, requiring less effort on their part.
Conjoint Analysis Question Examples
Choice-Based Conjoint Analysis Questions
- Which of the following smartphones would you buy for $700?
- Pricing Option: A single product
- Answers: DIfferent phone attributes
- If we offered a new kind of sneaker, which of the following options would be most appealing to you? Please make one choice per set. If no options look appealing, choose "None."
- Pricing Option: 3-4 prices
- Answers: Different styles, brands and price points
MaxDiff Conjoint Analysis Questions
- When choosing a price point for a resort, what are the least and most important factors in your decision?
- Pricing Option: Most important, least important fill-in options
- Answers: Pool availability, Gym availability, Suite availability, Price
- Which are the most unlikely and likely prices that would make you buy this product?
- Pricing Option: Various price points
- Answers: Respondents choose 2: 1 very unlikely price and 1 very likely in a set of price options
Setting the Right Prices
Setting the right prices for different products and services can be tricky, but it shouldn’t be an ordeal — not with the proper survey platform, that is.
The key to mastering price research campaigns is to use a strong online survey platform, as not all market research platforms offer the same capabilities, features and customer support.
Use an online market research platform that allows you to easily target your survey audience, create your questionnaire and deploy it to the masses (or to specific people).
Luckily, Pollfish facilitates all three of these critical aspects in the survey creation and distribution process.
We offer two methods of survey distribution: deploying surveys across a large network of random internet users in their natural digital environments via our Random Device Engagement (RDE) method, as well as the option to target specific customers in specific online spaces with the Distribution Link feature.
Additionally, Pollfish survey software allows you to create and analyze a thorough survey data collection, one you can customize, view and organize however you like.
In addition, with our vast array of question types, you can create virtually any type of pricing research survey to support your market research campaign.
You can also leverage a wide range of information on your respondents by accessing a wide pool of insights in your survey results dashboard.
With a market research platform this advanced, you can easily create a pricing survey and conduct data-driven pricing research campaigns to win over all of your customers.
Complete Your Real-Time Market Research with a Survey Platform
Complete Your Real-Time Market Research with a Survey Platform

You may have come across real-time market research, a modern version of what essentially is ethnographic research.
That’s because businesses are constantly being swamped with different types of data collection methods — and software companies making all sorts of promises on the capabilities of their data.
This results in a kind of data overload: In 2022, 97.2% of businesses are investing in big data and AI. Despite this seemingly omnipresent investment, only 32% of businesses are able to realize tangible and measurable value from their data.
This rings true in market research as well, which provides a groundswell of data on customers and market trends. Among them is the said real-time market research.
Real-time market research is often part of the data advertised as necessary to businesses so that they can understand their customers. But this is not the same as real-time results data, despite the similarity in name.
Neither is it the same as survey research and other forms of agile market research.
However, it can be used in tandem with agile market research. The key is to do so correctly and to fully understand what real-time research entails.
This article lays out real-time research, how it's conducted, its importance and how it can be used alongside agile market research, specifically survey studies campaigns.
Understanding Real-Time Market Research
As its name suggests, real-time market research is a kind of data collection method that garners information on customers in real time. This is to say that it involves collecting insights on customers’ experiences as they occur.
This may appear to be much like an ethnographic approach, which is a traditional market research method.
Ethnographic research is a kind of qualitative market research method for collecting data. In this method, data is collected through firsthand observations, which are then used to draw conclusions about customers.
Customers are thus observed in their natural environments rather than being interviewed after the fact.
These natural environments that customers frequent include:
- Malls
- Stores
- On the street
- Watching an advertisement
- While speaking or interacting with them
- Customer support sessions
- Digital environments (more on this in the real-time results research section below)
While it may seem to be outdated, it has been modernized in the form of real-time research, with different software companies offering tools for businesses to monitor their customers in the here and now.
Real-Time Market Research Vs Other Forms of Research
As you know, there is a plethora of research methods you can leverage for your studies.
Real-time is a form of research that should not be confused with other kinds, regardless of how similar in name they may sound, or how similar in function they may appear to one another.
There are a variety of legacy market research methods, such as snail mail surveys, telephone calls, in-person interviews and research panels.
However, for the purpose of this article, we’ll discuss how the real-time research approach differs from two major kinds of research: agile and real-time results research.
How Real-Time Differs from Agile Research
Real-time market research differs from agile research in that real-time is a method of collecting information by way of drawing data on a customer’s experience as it is happening.
As such, it is centered on customer experience and is therefore used to gain a clear understanding of customer reflections and their behaviors, as they’re manifesting them.
Agile market research, on the other hand, is a kind of research driven by iterative and incremental software development processes. It is predicated on getting insights on customer behaviors and sentiments, after they have occurred.

It is also different, in that it is also bent on rapid and flexible responses from respondents — these are often automated via software such as automated surveys. This agile method gives way to many benefits, such as faster time-to-market, low costs and improved quality of outputs.
Like many other kinds of market research, agile market research methods are primarily focused on forming statistics, while real-time research is based on data science.
As opposed to the reality of customer experience, the agile approach deals with the reflections of customers.
The biggest difference between these two forms of research is that in agile research, you would explicitly ask your respondents questions, while you wouldn’t in the real-time research method.
How Real-Time Differs from Real-Time Results Research
While they sound similar, these two forms of market research differ considerably. Interestingly enough though, real-time research can be a form of real-time results research.
First, let’s understand the core of real-time results research.
Real-time results research is a kind of research method in which customer data is collected in real-time.
However, unlike in real-time research, the real-time results method is based on data. Thus, the real-time results approach is focused on observing customers in the digital space, not in physical places.
The data becomes available as different data visualizations, which researchers can see being updated in real-time.
On the contrary, real-time research is driven by observing customer actions in the physical realm. It is therefore a modern version of ethnographic research since it also obtains information from consumers without explicitly asking them questions.
However, it too can apply to observing customer data in real-time. Thus, in this way, it is a form of real-time results research.
As such, it is easy to see why these two methods are often used hand in hand.
How to Conduct Real-Time Market Research
Real-time market research has evolved along with the broader market research industry. Gone are the days when the only way to conduct it was by watching customers in person or interacting with them (however, you can still use these methods as well).
The following is a list of the ways you can conduct this form of research:
- Social media listening
- Session replay tools
- Predictive analytics
- Field marketing
- Speaking and interacting with customers at trade shows, grand openings, etc
- Viewing how social media posts are engaged with
- Viewing how advertisements are engaged with
All in all, you can use any method of collecting data, as long as it gives you a firsthand glimpse into a customer’s experience as it is happening.
The Importance of Real-Time Market Research
This kind of research method is important on several accounts.
First off, it provides an alternative to agile methods of data for decision-making. This is important to researchers who seek to gather information on customer behavior as it exists at the moment rather than studying it retroactively.
This is also important, as it can be used as a comparison method to compare current behaviors and sentiments as they exist, with those of the past. In this way, it can be used for comparing the data from longitudinal studies.

In addition, this kind of research approach is critical to satisfying the need for a sharper understanding of customer reflections and behaviors. That’s because agile data can’t always capture everything, as some respondents forget things while others fall victim to selective memory.
Real-time research is also a must for client-side marketers who are in demand of immediate data, the kind they can access at any time of the day.
What’s more is that you can use it as a kind of real-time results research, by evaluating the performance of customers’ digital activities. They can do so via the tools mentioned in the prior section.
The greatest benefit of this kind of research is that it can be used in conjunction with agile market research, such as the kind you get from software such as survey platforms.
Using Survey Research with Real-Time Market Research
The ultimate verdict on real-time research is that it should never be a lone market research effort. Instead, it should be used in tandem with other forms of research, such as the aforementioned agile research.
Why? It’s simple. The insights you derive via the real-time method are far from sufficient.
They become truly invaluable, however, when you pair them with agile data. With both types of research in tow, you will be able to conduct an exhaustive research campaign.
That’s because these two forms of research complement each other. When you don’t have enough information from one, you can conduct the other type to make up for the gaps in insights.
For example, say you begin with real-time research. While the observations you made were interesting, they are likely to set off a bunch of questions in relation to the activities you watched. Thus, you would follow up with agile research, specifically via a survey campaign.
In this dual approach, you’ll get ethnographic research, coupled with answers to the questions that stemmed from it. Thus, you’ll have a full-picture understanding of the subjects you’re studying.
You can also compare real-time research with historical data or market trends. Much of this data can be conducted via the agile method as well, especially when it comes to longitudinal research.
In addition, you can also combine the agile and real-time methods via brand trackers.
These are ideal for uncovering seasonal and ongoing trends, unlike real-time, which shows you what’s occurring in the present.
Thus, you can compare the data from both for a strong understanding of your customers and how they feel about your business.
The final key takeaway is that real-time market research provides a key aspect of research on your consumers. But it should never be used on its own; it is best to use it to complement agile research, as automated surveys help fill the void in what a real-time campaign lacks.
Perfecting Your Research Needs
The real-time approach to market research can come in handy whenever you seek to study customer activities and behaviors as they are happening. This kind of research adds another facet to your survey studies.
You should always use it with agile research, particularly surveys, as surveys can uncover virtually anything, depending on the questions you use with it.
You should therefore select your platform carefully. A strong market research company will allow you to carry out and fulfill all of your market research activities.
We suggest using a survey platform that offers a wide range of capabilities and functionalities. This will ensure a valuable campaign that is rich in insights, as well as granting you ease of deployment and analysis.
Pollfish survey software allows you to create a thorough survey data collection, one you can customize to your liking, view however you choose and organize it to the max.
In addition, with our vast array of question types, you can create any type of online market research survey to support your research campaigns.
Researchers can leverage a wide pool of information on their respondents by accessing the data in their survey results dashboard.
When you have the support of such a market research platform, you can truly create multifaceted research experiences to inform all of your curiosities about your customers.
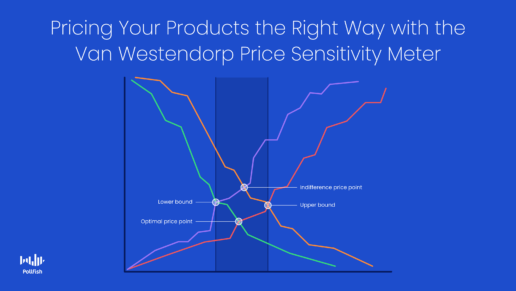
Pricing Your Products the Right Way with the Van Westendorp Price Sensitivity Meter
Pricing Your Products the Right Way with the Van Westendorp Price Sensitivity Meter (Updated)
 The Van Westendorp Price Sensitivity Meter is an essential market research tool for determining the price of a new product or tweaking that of an existing product.
It allows businesses of varying sizes and industries to set the proper price of their offerings, one that is in line with customer expectations. After all, pricing is a key aspect of a product’s success.
When it comes to the success of a product or service, everything comes second to price. While this may appear to be an exaggeration, it rings true, especially during the pandemic. Consumers are now more price-conscious than ever before.
In fact, 45% of consumers switched brands to save money in the past year. Consumers are well aware of any signs of inflation, as 77% of consumers have noticed higher prices and over half of consumers are shopping at multiple businesses to find the best price — 53% of customers research multiple stores in search of the best price, specifically.
Fortunately, although it is only February, we’ve got another feature making the rounds on the Pollfish online survey platform. The Van Westendorp Price Sensitivity Meter enables researchers to research customers’ willingness to pay for products and services.
This article explains what the Van Westendorp Price Sensitivity Meter is, its importance, what it is like on Polllfish and more.
Understanding the Van Westendorp Price Sensitivity Meter
Also called the Van Westendorp Price Sensitivity Analysis (PSA) in addition to the Price Sensitivity Meter (PSM), this is a pricing model that provides data for decision-making in regard to consumer price preferences. As such, it is used to determine customers’ willingness to pay a range of prices.
In doing so, it helps conclude the prices that your target market deems acceptable, too high, too low and optimal.
The PSA entered the market research sphere in 1976 by the Dutch economist Peter Van Westendorp. This approach is still in use throughout the market research industry, particularly for product development and to aid pricing strategies.
The meter itself is a visualization in the form of a graph, which presents ratings on price and value from customers. This data is presented by way of responses to survey questions that focus on the prices of different products and services.
This way, researchers and business owners can understand whether their pricing is too high or too low.
The Importance of the Van Westendorp Price Sensitivity Meter
The Price Sensitivity Meter is important on a number of accounts.
First off, it clearly lays out a wide range of price points in relation to how customers feel about them. As the introduction proves with several statistics and editorial sources, pricing is one of the most of not the most important factors when it comes to product success.
Consumers are more conscious than ever due to inflation and other economic downturns brought about by the Covid-19 pandemic. What makes sense to business owners or product marketers does not always align with the expectations and customer buying behavior of customers.
Therefore, businesses should always stay in the know of their customers and this applies to their thoughts, hopes and aversions to different price ranges and points. The PSM is an easy way to access this necessary consumer sentiment.

When it comes to going to market, it is crucial to have a deep understanding of how customers value a product and they view its accompanying price. If you don’t, you will certainly disappoint many current and prospective customers, as there will be less of a demand for your product.
In this way, satisfying your customers with good pricing helps you both maintain and increase your customer retention rate along with helping you avoid raising your customer acquisition cost.
While conducting secondary research is a good starting point, it does not provide you with concrete information on your own customers and products, no matter how similar other products in your niche are to yours. Thus, the PSM is a useful tool, as it provides you firsthand information on your own customers and their thoughts about specific prices and products.
The PSA technique is also important, as it is often used during the new product phase, such as in the customer development process to assist you in setting the right price. In this case, the van Westendorp PSM uncovers a potent entry price strategy.
When it comes to established brands and existing products, the PSM will guide your pricing strategy for repositioning a product, or advertising it with new features. In any case, the PSM is a useful tool in gauging price sentiment from your customers and setting the right prices for all your offerings.
How the Van Westendorp Price Sensitivity Meter Works
The PSA begins with researchers’ using an input, which is respondent data based on questions revolving around products and their accompanying price.
The researcher will first present respondents with a product or service, which can be just about anything. They will attempt to get the respondents to become familiar with the product or service and then ask them four questions on it. These serve as the basis of the Price Sensitivity Meter, which the research will then input into the PSM chart.
This method involves using a description of the product or service at hand, which can exist as a video, image or audio file, or text. After respondents view this information, they are then asked the four Van Westendorp questions.
Following this, the results of the questions are entered on the Van Westendorp chart. Let’s learn how they appear on the Pollfish platform.
The Van Westendorp Price Sensitivity Meter in Pollfish

The Pollfish online platform presents the results of the PSA method in the aforementioned chart. The chart is a representation of the cumulative percentage of respondents/price.
The Price Sensitivity Meter appears as the following on the platform:

This chart is the outcome of the PSA approach, showing researchers the price range from the lower bound to the upper bound for the product/service. It also allows them to unearth the “optimal price” point and the “indifferent price point.”
This marks the end of the standard or basic PSM. However, the Pollfish platform offers an enhancement to this market research technique. This is called the Newton-Miller-Smith Extention.

The NMS extension grants researchers the ability to add additional questions (2 or more) about the likelihood of customers purchasing the products and services they were shown/ asked about.
These questions will appear after the four Van Westendorp ones. They exist as rating scales. For example: “On a scale of 1-7, how likely are you to buy this product?”

Ultimately, this extension allows researchers to not only understand customers’ sentiments towards price points, but to ascertain whether they will buy the products or not.
The Van Westendorp Price Sensitivity Meter Survey Questions
These questions remain the same in the PSA model. The following displays these survey questions: questions, which exist as numeric, open-ended survey questions.
- At what price would you consider the product to be priced so low that you would feel the quality couldn’t be very good?
- Discovers whether a price is too cheap
- At what price would you consider the product to be a bargain—a great buy for the money?
- Discovers whether a price is either on the cheaper end or a good value
- At what price would you consider the product starting to get expensive, so that it is not out of the question, but you would have to give some thought to buying it?
- Determines whether a price is expensive or on the upper pricing echelon.
- At what price would you consider the product to be so expensive that you would not consider buying it?
- Determines whether a price is too expensive or on the upper pricing echelon.
Using Advanced Skip Logic (2022 Update)
The Van Westendorp Pricing Meter now supports the usage of the Pollfish advanced skip logic feature. This valuable addition to the Price Sensitivity Meter enables you to route respondents to relevant follow-up questions based on their previous answers. Thus, you can create a deep dive into customers by asking them questions based on their specific answers from a prior question.
You can use advanced skip logic when a respondent exits the Van Westendorp PSM. This new capability strengthens and empowers the PSM to be more relevant and personalized to respondents' survey experience.
Forming Optimal Pricing Strategies
Forming an optimal price strategy is difficult; this is compounded when you consider shifting expectations with new seasons. After all, you ought to stand out from your competitors by offering better prices, but also ensure that you’re not selling yourself short.
The Van Westendorp Price Sensitivity Meter allows you to do just that, saving you the guesswork and hesitation in setting prices across all your products and services. What’s best is that it is included in the Pollfish online survey platform.
Remember, you should use a market research platform that deploys surveys within a mass network of publishers, ones that account for major websites, apps and mobile sites, along with one that also grants you the ability to send surveys your own way.
A strong market research platform will also attract your survey audience with an appealing digital element that leads to your survey and easily grabs users’ attention. In addition, it will partner with publishers who gamify surveys, allowing respondents to gain incentives while playing a game, making the experience far from boring.
You should also opt for an online research platform that makes buying survey respondents a quick and simple process. This way, you’ll collect all your necessary data from the right respondents in a short space of time.
Additionally, use a platform that features artificial intelligence and machine learning to remove low-quality data and offer a broad range of survey and question types.
Applying an online survey platform with all of these capabilities will empower you to reach any survey audience and gain all of their thoughts on all price ranges, allowing you to form smarter and more effective pricing strategies.